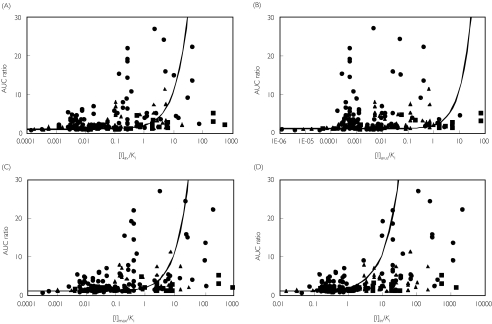
Figure 2.
Relationship between the observed AUC ratio and the various [I]/Ki ratios for drug-drug interactions involving CYP3A4 (•), CYP2D6 (▴) or CYP2C9 (▪). The curves represent the theoretical curves based on equation 1 using average systemic total drug plasma concentration ([I]av– panel A), average systemic unbound drug plasma concentration ([I]av,u– panel B), maximum systemic plasma concentration ([I]max– panel C), and maximum hepatic input concentration ([I]in– panel D)

