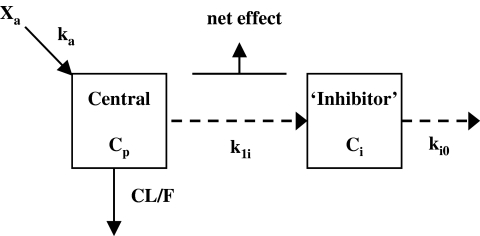
Figure 2.
Schematic of the tolerance model used to describe the effects of ephedrine on systolic blood pressure. ka, the absorption rate constant; CL/F, the apparent oral clearance; Cp, plasma concentration; k1i, rate constant for tolerance development; ki0, rate constant for the disappearance of tolerance; Ci, hypothetical ‘inhibitor’ concentration

