An official website of the United States government
Here's how you know
Official websites use .gov
A
.gov website belongs to an official
government organization in the United States.
Secure .gov websites use HTTPS
A lock (
) or https:// means you've safely
connected to the .gov website. Share sensitive
information only on official, secure websites.

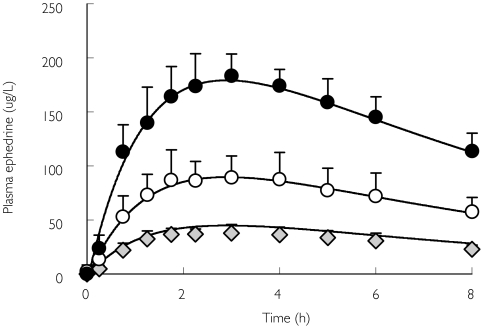
 , 0.5 (○) and 1.0 (•) mg kg−1 oral dosing. Data were modelled simultaneously with a one-compartment model incorporating a lag time, assuming first order absorption and elimination (solid line)