Abstract
Aims
Treatment with vitamin D sterols can lower plasma parathyroid hormone (PTH) in patients with secondary hyperparathyroidism; however, hypercalcaemia, hyperphosphataemia, or both, often develop. Calcimimetic agents, employed in alternative therapeutic approaches, directly inhibit PTH secretion by activating the calcium-sensing receptor in the parathyroid glands.
Methods
In this study, patients were given orally 25, 50, and 100 mg doses of the calcimimetic agent KRN 1493 each on two occasions, on the day of haemodialysis and on the day without haemodialysis.
Results
In the pharmacokinetic results, because the clearance of KRN 1493 by haemodialysis was much smaller than the systemic clearance, the influence of haemodialysis was not remarkable. In the pharmacodynamic study, on both the days with or without haemodialysis, plasma PTH concentrations decreased in a dose-dependent manner. Serum calcium concentrations decreased in association with the decrease in plasma PTH concentrations. Mild dose-dependent adverse effects (mainly nausea) were seen after the administration of KRN 1493 on both the day of haemodialysis and the day without haemodialysis.
Conclusions
We conclude that the pharmacokinetics of KRN 1493 after a single administration were similar on the day of haemodialysis and the day without haemodialysis. KRN 1493 is safe and effective in suppressing PTH secretion and serum calcium concentrations on the day of haemodialysis and on the day without haemodialysis in patients with secondary hyperparathyroidism.
Keywords: calcimimetic agent, calcium-sensing receptors, end-stage renal disease, KRN 1493, parathyroid hormone, secondary hyperparathyroidism
Introduction
Secondary hyperparathyroidism is characterized by parathyroid gland hyperplasia and increased concentrations of parathyroid hormone (PTH) [1, 2]. Elevated PTH concentrations may adversely affect a variety of organs, including the central nervous system, the heart and the lungs [3–5]. Furthermore, elevated PTH concentrations are associated with an increase in the relative risk of mortality [6]. Abnormalities of bone and mineral metabolism, which often reveal osteitis fibrosa, are another important complication in these patients [7, 8].
Current strategies for managing secondary hyperparathyroidism in patients with end-stage renal disease utilize calcium-containing phosphate-binding agents to control hyperphosphataemia, while vitamin D sterols are administered to lower PTH concentrations [9–12]. However, hypercalcaemia is common in patients treated with calcium-containing phosphate-binding agents, and serum calcium and phosphorus concentrations often rise after the administration of vitamin D [13–15]. Both therapeutic interventions may contribute to vascular and soft-tissue calcification [16]. Moreover, neither treatment immediately decreases PTH synthesis and secretion. Consequently, different therapeutic interventions that control PTH concentrations without raising serum calcium or phosphorus concentrations are needed.
In parathyroid cells, increases in extracellular calcium concentration activate the calcium-sensing receptors (CaSR) and diminish the release of PTH stored within secretory granules. Conversely, decreases in extracellular calcium concentration inactivate the CaSR and promote PTH release [17].
The chemical compound KRN 1493, referred to as AMG073 (Cinacalcet hydrochloride) in the United States, represents a new class of compounds known as calcimimetics. Because calcimimetic agents act on the parathyroid gland CaSR, increasing their sensitivity to extracellular calcium and thereby reducing PTH secretion [18, 19], calcimimetics have been proposed as a therapy for hyperparathyroidism that does not increase serum calcium concentration [20]. In studies on nephrectomized rats, the calcimimetic compound KRN 568 (NPS R-568) inhibited the progression of osteitis fibrosa and prevented parathyroid hyperplasia [21–23]. These results suggested that calcimimetics could be a potent therapeutic approach for the treatment of secondary hyperparathyroidism.
Because changes in PTH release that are mediated through the CaSR occur rapidly [24], calcimimetics reduce plasma PTH concentrations within 1–2 h of oral administration in humans [25]. On the other hand, both vitamin D and calcium inhibit prepro-PTH gene transcription directly by interacting with distinct upstream negative regulatory elements within the DNA, so they lower plasma PTH concentrations over many hours or even several days [12, 24]. The rapid onset of the effects of calcimimetic agents suggests that these compounds may permit precise pharmacological control of PTH secretion in patients with secondary hyperparathyroidism.
Although the activity of KRN 1493 has been studied [20, 26], little is known about the relationship between the plasma concentrations of intact PTH and the plasma concentrations of ionized calcium after administration of KRN 1493. Moreover, less information is known about the effect of dialysis on the pharmacokinetics and pharmacodynamics of KRN 1493.
This study was designed to investigate the relationship between the plasma concentrations of intact PTH and the plasma concentrations of ionized calcium after KRN 1493 was administered in 25, 50, or 100 mg doses on two occasions, on the day of haemodialysis and on the day without haemodialysis.
Methods
Study population
Before implementation of this study, the research protocol and consent forms were reviewed and approved by the Ethics Committee of Shitoro Clinic (Hamamatsu, Japan). All patients who participated in this study gave written informed consent. Eight patients (five men and three women, age 50–63 years, and weighing 41–64 kg) with end-stage renal disease who had been undergoing long-term haemodialysis treatment (range of duration, 7 years 11 months to 25 years 2 months) participated in the study. End-stage renal disease was due to chronic glomerular nephritis in six patients and diabetic nephropathy in the other two patients. All patients had biochemical evidence of secondary hyperparathyroidism, as determined from the results of plasma PTH concentrations (mean, 794.6 ng l−1; range, 475–1330 ng l−1) obtained less than 4 weeks before the first dose of KRN 1493. Patients receiving vitamin D sterols and calcium-containing phosphate-binding agents were required to be on a stable dose for 4 weeks before enrolment. The dialysate calcium concentration (1.25 mmol l−1) was kept constant in all patients throughout the study.
Study design
Pharmacokinetics, pharmacodynamics, and clinical safety were examined in all eight patients. They were given the calcimimetic agent KRN 1493 orally in 25, 50, or 100 mg doses on two occasions, first on the day without haemodialysis and then, 1 week later, on the day of haemodialysis.
On the first dosing occasion, the patients underwent their usual haemodialysis treatment 24 h after the 25 mg dose of KRN 1493. On the second dosing occasion, patients started their regular haemodialysis treatment immediately after the 25 mg dose of KRN 1493. Haemodialysis was performed for 4 h with double-needle access in the arteriovenous fistula, a cellulose triacetate hollow-fibre dialyser (FB, NIPRO, Osaka, Japan) with a filter surface area of 1.5–2.1 m2, and haemodialysis apparatus (NCU-8, NIPRO, Osaka, Japan). The dialysate flow was 500 ml min−1 and the blood flow (QB) was 200 ml min−1. One week after the two 25 mg doses, the same eight patients received two 50 mg doses of KRN 1493 following the same protocol, and 1 week after the two 50 mg doses, the same eight patients received two 100 mg doses of KRN 1493 following the same protocol.
All symptoms and signs, either observed by the investigators or reported by the subject spontaneously or in response to a direct question, were noted. If any adverse experience occurred after drug administration, the subject was given the appropriate treatment and close medical supervision. Causality and severity rating of clinical adverse experiences were determined.
Blood samples were obtained just before (0 h) and then 0.5, 1, 1.5, 2, 3, 4, 6, 8, 12, 24, 48, 72 and 96 h after KRN 1493 was given orally. Blood biochemistry and other haematology tests were performed on blood samples taken on four occasions: at the initial screening, immediately before KRN 1493 was given, 24 h after KRN 1493 was given and 96 h postdosing. Vital signs, including body temperature and blood pressure, were monitored just before and periodically up to 96 h after drug administration.
Analytical methods
Haematological tests were performed at Shitoro Clinic with automated equipment (model K-4500; Sysmex, Kobe, Japan). Blood biochemistry assays were conducted at Mitsubishi Kagaku BCL (Tokyo, Japan). Plasma PTH concentrations were measured with an immunoradiometric assay (Allegro intact PTH; Kyowa Medics, Tokyo, Japan). Serum calcitonin concentrations were measured by radioimmunoassay (Calcitonin RIA ‘Yuka’, Mitsubishi Kagaku Medical, Tokyo, Japan). Autoanalysers were used to measure serum concentrations of total calcium (Olympus AU5232) and phosphorus (Olympus AU800). Serum ionized calcium concentrations were measured by the electrode method (Ca2+/pH autoanalyser model 634, Chiron, Emeryville, CA, USA) and values corrected to pH 7.40 were used. The plasma concentration of KRN 1493 was measured at Mitsubishi Kagaku BCL, Tokyo, Japan. The validated SPE/LC-MS/MS method was used to determine the plasma concentration of KRN 1493. The analytical procedures have utilized LC-MS/MS using electrospray ionization (positive mode) and the limit of quantification was 0.1 ng ml−1.
Pharmacokinetic analysis
The Win Nonlin version 3.1 (Pharsight Corporation, Mountain View, CA) was used throughout the pharmacokinetic analysis. Plasma concentration-time data of KRN 1493 were analyzed by noncompartmental methods and individual pharmacokinetic parameters for each patient were calculated. After dosing, the maximum plasma concentration (Cmax) and the time to reach maximum plasma concentration (tmax) were recorded. The terminal elimination rate constant was determined by regression analysis of the log linear terminal segment of the plasma concentration-time curve and the terminal half-life (t1/2) was calculated as t1/2 = ln2/terminal elimination rate constant. The area under the plasma concentration-time curve (AUC) and the area under the moment curve (AUMC) were calculated according to the trapezoidal rule and extrapolating to infinity. The apparent clearance (CL/F) was calculated using the following relationship: CL/F = Dose/AUC. The mean residence time (MRT) was determined as: MRT = AUMC/AUC. The clearance by haemodialysis was calculated as: Dialytic clearance = [(Pre-dialytic concentration − Post-dialytic concentration)/Predialytic concentration] × 200 (ml min−1, rate of dialytic blood flow).
In the case of one subject (7), a peak from an unknown cause interfered with the exact quantification of the plasma concentration of KRN 1493 in the low concentration range. Therefore, the data obtained from this subject were excluded from the calculations of AUC, CL/F, t1/2, and MRT.
Statistical analysis
All results are expressed as mean ± SD. Changes in the concentrations of plasma intact PTH and serum ionized calcium from baseline (predose) values were analyzed by using the Dunnett type test; a P value below 0.05 was considered to indicate a statistically significant change. The influences of dose or haemodialysis on the pharmacokinetic parameters AUC and Cmax were assessed using an analysis of variance (anova) model.
Results
Pharmacokinetic results
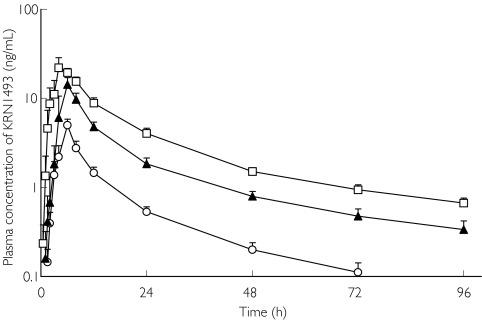
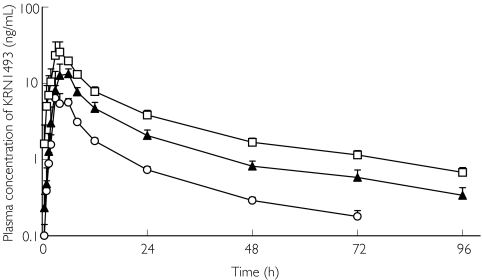
Figures 1 and 2 illustrate the profiles of the mean plasma concentrations of KRN 1493 with and without haemodialysis. The mean plasma concentrations increased with the dosage of KRN 1493. The Cmax of KRN 1493 was observed after 4–6 h and thereafter, it disappeared biphasically. The tmax, t1/2, and MRT were almost independent of the dose. The 95% confidence interval for the ratio of the log-transformed AUC was 1.10-1.33 and that for Cmax was 1.21-1.59. Haemodialysis did not increase the elimination of KRN 1493 because the clearance by haemodialysis was much less than the systemic clearance. The pharmacokinetic parameters with and without haemodialysis are summarized in Tables 1 and 2.
Figure 1.
Plasma concentration of KRN 1493 after oral administration on the day without haemodialysis. Each point is the mean with SD indicated by the bars. 25 mg (○), 50 mg (▴), 100 mg (□)
Figure 2.
Plasma concentration of KRN 1493 after oral administration on the day of haemodialysis. Each point is the mean with SD indicated by the bars. 25 mg (○), 50 mg (▴), 100 mg (□)
Table 1.
Pharmacokinetic parameters on the day without haemodialysis
| Dose(mg) | Cmax (ng ml−1) | tmax (h) | AUC(ng ml−1 h) | CL/F(l h−1) | t1/2(h) | MRT(h) |
|---|---|---|---|---|---|---|
| 25 | 4.66 | 6 | 62.2 | 402 | 22.6 | 27.0 |
| (1.75, 9.74) | (3, 6) | (19.5, 90.2) | (277, 1280) | (7.78, 50.9) | (12.6, 35.1) | |
| 50 | 18.5 | 6 | 227 | 221 | 34.6 | 36.4 |
| (5.98, 37.1) | (4, 8) | (64.1, 352) | (142, 779) | (14.1, 77.2) | (17.0, 57.9) | |
| 100 | 21.1 | 4 | 418 | 239 | 36.6 | 35.6 |
| (14.1, 63.0) | (3, 8) | (211, 574) | (174, 474) | (29.5, 53.3) | (25.2, 37.4) |
Data are expressed as median (min, max). Cmax and tmax were calculated from data obtained from all subjects for each dose. Data obtained from subject 7 were excluded from the calculations of AUC, CL/F, t1/2, and MRT. Cmax maximum plasma concentration; tmax time to reach maximum plasma concentration; AUC the area under the plasma concentration-time curve; CL/F, the apparent clearance; t1/2, terminal half-life; MRT, mean residence time.
Table 2.
Pharmacokinetic parameters on the day of haemodialysis
| Dose (mg) | Cmax (ng ml−1) | tmax (h) | AUC (ng ml−1 h) | CL/F (l h−1) | Clearance with haemodialysis (ml min−1) | t1/2 (h) | MRT(h) |
|---|---|---|---|---|---|---|---|
| 25 | 8.48 | 5 | 86.8 | 288 | −6.72 | 33.3 | 28.2 |
| (4.37, 24.8) | (3, 6) | (35.6, 122) | (204, 702) | (−23.5, 14.5) | (11.9, 50.5) | (16.4, 36.7) | |
| 50 | 19.3 | 5 | 222 | 225 | 9.43 | 35.6 | 31.8 |
| (7.60, 50.6) | (2, 6) | (82.3, 357) | (140, 607) | (−0.2, 31.0) | (12.9, 44.5) | (15.9, 42.8) | |
| 100 | 27.2 | 5 | 375 | 266 | 15.3 | 38.2 | 29.8 |
| (15.0, 96.4) | (1.5, 6) | (205, 568) | (176, 488) | (-20.9, 117) | (33.7, 55.0) | (27.5, 48.6) |
Data are expressed as median (min, max). Cmax, tmax and clearance with haemodialysis were calculated from data obtained from all subjects for each dose. Data obtained from subject 7 were excluded from the calculations of AUC, CL/F, t1/2, and MRT. Cmax maximum plasma concentration; tmax time to reach maximum plasma concentration; AUC the area under the plasma concentration-time curve; CL/F the apparent clearance; t1/2 terminal half-life; MRT mean residence time.
Pharmacodynamic results on the day without haemodialysis
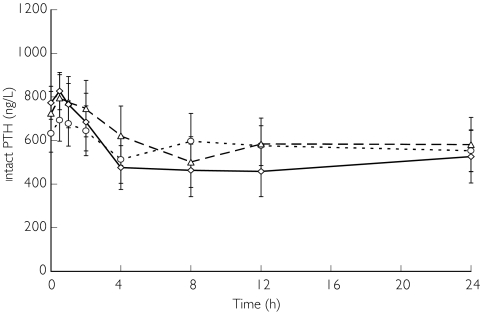
Figure 3 illustrates plasma PTH concentrations on the day without haemodialysis when they decreased in a dose-related manner. The minimum PTH concentrations were obtained 4–8 h after the administration of 25 mg or 50 mg of KRN 1493, and 12 h after the administration of 100 mg. The mean plasma PTH concentrations decreased 24 h after administration of KRN 1493, falling 15.4% from baseline after the 25 mg dose, 23.5% from baseline after the 50 mg dose, and 37.0% from baseline after the 100 mg dose. Statistically significant decreases (P < 0.05) in the plasma PTH concentrations were observed 4 h after administration of the 25 mg dose, 8 h after administration of the 50 mg dose, and from 4 to 24 h after administration of the 100 mg dose.
Figure 3.
Effect of KRN 1493 on intact PTH concentration after oral administration on the day without haemodialysis. Each point is the mean with SD indicated by the bars. 25 mg (○), 50 mg (▵), 100 mg (◊)
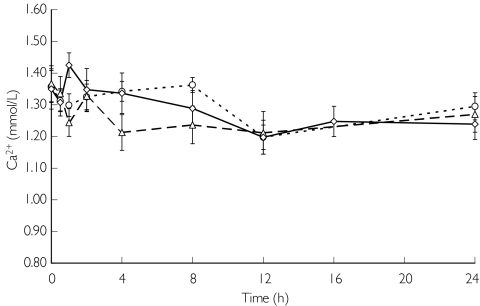
Figure 4 illustrates serum ionized calcium concentrations on the day without haemodialysis. Serum ionized calcium concentrations and corrected serum calcium concentrations continued to decrease with the plasma PTH concentrations (data not shown). Serum ionized calcium concentrations decreased for the first 8 h, remained low from 8 to 12 h after administration of KRN 1493, and thereafter gradually returned to baseline. Statistically significant decreases (P < 0.05) in the serum ionized calcium concentrations were observed 12 h after administration of the 25 mg dose, 1, 4, 8, 12 and 24 h after administration of the 50 mg dose, and 1, 12 and 24 h after administration of the 100 mg dose.
Figure 4.
Effect of KRN 1493 on serum ionized calcium concentration after oral administration on the day without haemodialysis. Each point is the mean with SD indicated by the bars. 25 mg (○), 50 mg (▵), 100 mg (◊)
Although serum calcitonin concentrations tended to increase in a dose-related manner, changes from baseline were not statistically significant and these concentrations were within normal limits on the day without haemodialysis.
Although plasma phosphorus concentrations tended to decrease after the administration of KRN 1493, the changes were not statistically significant on the day without haemodialysis.
Pharmacodynamic results on the day with haemodialysis
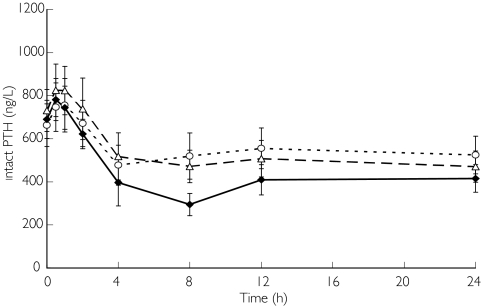
Figure 5 illustrates plasma PTH concentrations on the day with haemodialysis. The mean plasma PTH concentrations decreased 24 h after the administration of KRN 1493, falling 22.0% from baseline after administration of the 25 mg dose, 36.2% after administration of the 50 mg dose, and 40.8% after administration of the 100 mg dose. Statistically significant decreases (P < 0.05) in plasma PTH were observed 4 h after administration of the 25 mg dose and from 4 to 24 h after administration of the 50 mg and 100 mg doses.
Figure 5.
Effect of KRN 1493 on intact PTH concentration after oral administration on the day of haemodialysis. Each point is the mean with SD indicated by the bars. 25 mg (○), 50 mg (▵), 100 mg (♦)
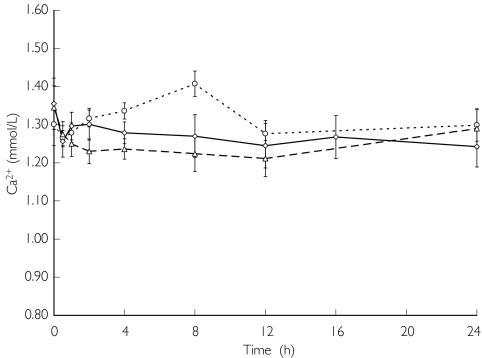
Figure 6 illustrates serum ionized calcium concentrations on the day with haemodialysis. Statistically significant decreases (P < 0.05) in serum ionized calcium concentrations were observed 8 h after administration of the 25 mg dose, from 0.5 to 24 h after administration of the 50 mg dose, and 0.5, 4, 8, 12 and 24 h after administration of the 100 mg dose. Serum ionized calcium concentrations and corrected serum calcium concentrations continued to decrease with the plasma PTH concentrations (data not shown). Serum ionized calcium concentrations and corrected serum calcium concentrations on the day with haemodialysis reached slightly higher concentrations than those on the day without haemodialysis. These concentrations decreased for 12 h after the administration of KRN 1493, and thereafter gradually returned to baseline values.
Figure 6.
Effect of KRN 1493 on serum ionized calcium concentration after oral administration on the day of haemodialysis. Each point is the mean with SD indicated by the bars. 25 mg (○), 50 mg (▵), 100 mg (◊)
Serum calcitonin concentrations were within normal limits on the day of haemodialysis following all doses of KRN 1493.
Although serum phosphorus concentrations showed a decrease due to haemodialysis, the changes due to the administration of KRN 1493 were not remarkable on the day of haemodialysis.
Adverse effects
Table 3 illustrates the adverse effects on the day without haemodialysis. No adverse effects were noted after the administration of 25 mg of KRN 1493. However, after the administration of 50 mg, one patient reported appetite loss, one transitory discomfort, one transitory upper abdominal pain, and one transitory joint stiffness. After the administration of 100 mg, five patients reported appetite loss, four nausea, and two vomiting. Overall, the severity of the adverse effects was only mild.
Table 3.
Adverse effects of KRN 1493 on the day without haemodialysis
| KRN 1493 | |||
|---|---|---|---|
| Adverse effect | 25 mg | 50 mg | 100 mg |
| Nausea | 0 | 0 | 4 |
| Vomiting | 0 | 0 | 2 |
| Appetite loss | 0 | 1 | 5 |
| Discomfort | 0 | 1 | 0 |
| Upper abdominal pain | 0 | 1 | 0 |
| Joint stiffness | 0 | 1 | 0 |
Table 4 illustrates the adverse effects on the day of haemodialysis. No adverse effects were noted after the administration of 25 mg of KRN 1493. However, after the administration of 50 mg, one patient reported transitory involuntary muscle contraction, one nausea, and one appetite loss. After the administration of 100 mg, five patients reported nausea, five appetite loss, one vomiting, one transitory headache, and one transitory upper abdominal pain. Overall, the severity of the adverse effects was only mild.
Table 4.
Adverse effects of KRN 1493 on the day of haemodialysis
| KRN 1493 | |||
|---|---|---|---|
| Adverse effect | 25 mg | 50 mg | 100 mg |
| Headache | 0 | 0 | 1 |
| Involuntary movement | 0 | 1 | 0 |
| Nausea | 0 | 1 | 5 |
| Vomiting | 0 | 0 | 1 |
| Appetite loss | 0 | 1 | 5 |
| Upper abdominal pain | 0 | 0 | 1 |
Discussion
The results of this study indicate that treatment with the calcimimetic agent KRN 1493 effectively lowers PTH concentrations in patients with secondary hyperparathyroidism due to end-stage renal disease. When KRN 1493 is orally administered in single 25, 50, or 100 mg doses, the plasma PTH decreased in a dose-related manner. Moreover, although the serum phosphorus concentrations were not significantly decreased, the concentrations of serum ionized calcium and serum corrected calcium were decreased significantly. As a result, the calcium-phosphorus product in serum was also decreased. Elevated concentrations of serum phosphorus and calcium-phosphorus product are related to an increased risk of coronary artery disease and sudden death in end-stage renal disease patients, particularly with elevated PTH concentrations [27, 28]. When calcimimetic agents are administered, PTH and serum calcium concentrations decrease because the calcimimetic agents lower the set point for calcium-regulated PTH release, rendering parathyroid cells more sensitive to the inhibitory action of calcium [24]. After the plasma PTH concentrations fall abruptly following the administration of calcimimetic agents, the calcium and phosphorus efflux from bone into plasma may decrease substantially. This mechanism probably accounts for the reductions in serum calcium and phosphorus concentrations that occur after surgical parathyroidectomy, a clinical condition known as the ‘hungry bone syndrome’ [25]. Because PTH may indirectly stimulate RANKL-mediated osteoclast maturation and activity, reductions in PTH could diminish bone resorption [29].
Serum ionized calcium concentrations and corrected serum calcium concentrations on the day with haemodialysis reached slightly higher levels than those on the day without haemodialysis because of equilibrium with the dialysate calcium concentration.
Although serum calcitonin concentrations decreased in a dose related manner, they were within normal limits on the day without haemodialysis, and serum calcitonin concentrations were within normal limits on the day of haemodialysis at all dosages of KRN 1493. Hypercalcaemia stimulates the release of calcitonin and calcimimetic agents act on the CaSR in the parafollicular cells of the thyroid gland, increasing their sensitivity to extracellular calcium, thereby stimulating calcitonin secretion. In this study, the calcitonin concentrations remained within normal limits in spite of the remarkable decrease of PTH, perhaps due to tissue-specific differences in secondary signalling: calcium inhibition of PTH secretion occurs, in part, by decreasing PTH messenger ribonucleic acid (mRNA) production while calcium activation of parafollicular cells of the thyroid gland stimulates calcitonin secretion without altering calcitonin mRNA synthesis [30, 31].
When some agents are administered to patients who require haemodialysis, the pharmacokinetic results must be monitored because the agents have varying clearance. In this study, the clearance of KRN 1493 by haemodialysis was much less than the systemic clearance. The AUC and Cmax on the day with haemodialysis were only slightly higher than those on the day without haemodialysis, but these differences were not remarkable. Thus, administration of KRN 1493 is not restricted by its proximity to the time of haemodialysis.
When KRN 1493 was administered, some adverse effects was admitted. Some of them may have been due to hypocalcaemia. However, because nausea, vomiting, and other adverse effects occurred before the appearance of hypocalcaemia, they might be associated with the toxicity of KRN 1493. Further study is needed to correlate each effect with its source. However, because the severity of the adverse effects was only mild, we deemed that KRN 1493 was safe.
We conclude that we clarified the pharmacokinetics of a single administration of KRN 1493 both on the day of haemodialysis and on the day without haemodialysis. Because the influence of haemodialysis was not remarkable, administration of KRN 1493 is not restricted by its proximity to the time of haemodialysis. Moreover, we concluded that KRN 1493 was safe and effective in suppressing PTH secretion and decreasing ionized and corrected serum calcium concentrations both on the day of haemodialysis and on the day without haemodialysis in patients with secondary hyperparathyroidism who require haemodialysis.
In the near future, KRN 1493 may be a primary drug in these patients' treatment.
Acknowledgments
This study was supported by Kirin Brewery Co., Ltd. The authors are greatly indebted to the nursing and technical staff of Shitoro Clinic.
References
- 1.Slatopolsky E, Brown A, Dusso A. Pathogenesis of secondary hyperparathyroidism. Kidney Int. 1999;56(Suppl 73):S14–9. doi: 10.1046/j.1523-1755.1999.07304.x. [DOI] [PubMed] [Google Scholar]
- 2.Massry SG, Coburn JW, Popovtzer MM, Shinaberger JH, Maxwell MH, Kleeman CR. Secondary hyperparathyroidism in chronic renal failure. Arch Intern Med. 1969;124:431–41. [PubMed] [Google Scholar]
- 3.Massry SG, Smogorzewski M. Mechanisms through which parathyroid hormone mediates its deleterious effects on organ function in uremia. Semin Nephrol. 1994;14:219–31. [PubMed] [Google Scholar]
- 4.Rostand SG, Drueke TB. Parathyroid hormone, vitamin D, and cardiovascular disease in chronic renal failure. Kidney Int. 1999;56:383–92. doi: 10.1046/j.1523-1755.1999.00575.x. [DOI] [PubMed] [Google Scholar]
- 5.Bro S, Olgaard K. Effects of excess PTH on nonclassical target organs. Am J Kidney Dis. 1997;30:606–20. doi: 10.1016/s0272-6386(97)90484-4. [DOI] [PubMed] [Google Scholar]
- 6.Block GA, Hulbert-Shearon TE, Levin NW, Port FK. Association of serum phosphorus and calcium x phosphorus product with mortality risk in chronic hemodialysis patients: a national study. Am J Kidney Dis. 1998;31:607–17. doi: 10.1053/ajkd.1998.v31.pm9531176. [DOI] [PubMed] [Google Scholar]
- 7.Cundy T, Hand DJ, Oliver DO, Woods CG, Wright FW, Kanis JA. Who gets renal bone disease before beginning dialysis? Br Med J. 1985;290:271–5. doi: 10.1136/bmj.290.6464.271. [DOI] [PMC free article] [PubMed] [Google Scholar]
- 8.Sherrard DJ, Hercz G, Pei Y, et al. The spectrum of bone disease in end stage renal failure – an evolving disorder. Kidney Int. 1993;43:436–42. doi: 10.1038/ki.1993.64. [DOI] [PubMed] [Google Scholar]
- 9.Andress DL, Norris KC, Coburn JW, Slatopolsky EA, Sherrard DJ. Intravenous calcitriol in the treatment of refractory osteitis fibrosa of chronic renal failure. N Engl J Med. 1989;321:274–9. doi: 10.1056/NEJM198908033210502. [DOI] [PubMed] [Google Scholar]
- 10.Salusky IB, Kuizon BD, Belin TR. Intermittent calcitriol therapy in secondary hyperparathyroidism: a comparison between oral and intraperitoneal administration. Kidney Int. 1998;54:907–14. doi: 10.1046/j.1523-1755.1998.00045.x. [DOI] [PubMed] [Google Scholar]
- 11.Martin KJ, Gonzalez EA, Gellens M, Hamm LL, Abboud H, Lindberg J. 19-Nor-1-α-25-dihydroxyvitamin D2 (paricalcitol) safely and effectively reduces the levels of PTH in patients with hemodialysis. J Am Soc Nephrol. 1998;9:1427–32. doi: 10.1681/ASN.V981427. [DOI] [PubMed] [Google Scholar]
- 12.Goodman WG. Recent developments in the management of secondary hyperparathyroidism. Kidney Int. 2001;59:1187–201. doi: 10.1046/j.1523-1755.2001.0590031187.x. [DOI] [PubMed] [Google Scholar]
- 13.Chertow GM, Burke SK, Lazarus JM, et al. Poly [allylamine hydrochloride] (RenaGel): a noncalcemic phosphate binder for the treatment of hyperphosphatemia in chronic renal failure. Am J Kidney Dis. 1997;29:66–71. doi: 10.1016/s0272-6386(97)90009-3. [DOI] [PubMed] [Google Scholar]
- 14.Hsu CH. Are we mismanaging calcium and phosphate metabolism in renal failure? Am J Kidney Dis. 1997;29:641–9. doi: 10.1016/s0272-6386(97)90352-8. [DOI] [PubMed] [Google Scholar]
- 15.Cunningham J. What is the optimal regimen for vitamin D? Kidney Int. 1999;56(Suppl 73):S59–S64. doi: 10.1046/j.1523-1755.1999.07307.x. [DOI] [PubMed] [Google Scholar]
- 16.Block GA, Port FK. Re-evaluation of risks associated with hyperphosphatemia and hyperparathyroidism in dialysis patients: Recommendations for a change in management. Am J Kidney Dis. 2000;25:1226–37. doi: 10.1016/s0272-6386(00)70064-3. [DOI] [PubMed] [Google Scholar]
- 17.Brown EM. Four-parameter model of the sigmoidal relationship between parathyroid hormone release and extracellular calcium concentration in normal and abnormal parathyroid tissue. J Clin Endocrinol Metab. 1983;56:572–81. doi: 10.1210/jcem-56-3-572. [DOI] [PubMed] [Google Scholar]
- 18.Hammerland LG, Garrett JE, Hung BC, Levinthal C, Nemeth EF. Allosteric activation of the calcium receptor expressed in Xenopus laevis oocytes by NPS 467 or NPS 568. Mol Pharmacol. 1998;53:1083–8. [PubMed] [Google Scholar]
- 19.Nemeth EF, Steffey ME, Hammerland LG, et al. Calcimimetics with potent and selective activity on the parathyroid calcium receptor. Proc Natl Acad Sci USA. 1998;95:4040–5. doi: 10.1073/pnas.95.7.4040. [DOI] [PMC free article] [PubMed] [Google Scholar]
- 20.Nemeth EF. Calcium receptors as novel drug targets. In: Bilezikian JP, Raisz LG, Rodan GA, editors. Principles in Bone Biology. San Diego: Academic Press Inc; 1996. pp. 1019–35. [Google Scholar]
- 21.Wada M, Furuya Y, Sakiyama J, et al. The calcimimetic compound NPS R-568 suppresses parathyroid cell proliferation in rats with renal insufficiency. J Clin Invest. 1997;100:2977–83. doi: 10.1172/JCI119851. [DOI] [PMC free article] [PubMed] [Google Scholar]
- 22.Wada M, Ishii H, Furuya Y, Fox J, Nemeth EF, Nagano N. NPS R-568 halts or reverses osteitis fibrosa in uremic rats. Kidney Int. 1998;33:448–53. doi: 10.1046/j.1523-1755.1998.00782.x. [DOI] [PubMed] [Google Scholar]
- 23.Wada M, Nagano N, Furuya Y, Chin J, Nemeth EF, Fox J. Calcimimetic NPS R-568 prevents parathyroid hyperplasia in rats with severe secondary hyperparathyroidism. Kidney Int. 2000;57:50–8. doi: 10.1046/j.1523-1755.2000.00837.x. [DOI] [PubMed] [Google Scholar]
- 24.Goodman WG. Calcimimetic agents and secondary hyperparathyroidism: treatment and prevention. Nephrol Dial Transplant. 2002;17:204–7. doi: 10.1093/ndt/17.2.204. [DOI] [PubMed] [Google Scholar]
- 25.Goodman WG, Hladik GA, Turner SA, et al. The calcimimetic agent AMG 073 lowers parathyroid hormone levels in hemodialysis patients with secondary hyperparathyroidism. J Am Soc Nephrol. 2002;13:1017–24. doi: 10.1681/ASN.V1341017. [DOI] [PubMed] [Google Scholar]
- 26.Lindberg JS, Moe SM, Goodman WG, et al. The calcimimetic AMG 073 reduces parathyroid hormone and calcium x phosphorus in secondary hyperparathyroidism. Kidney Int. 2003;63:248–54. doi: 10.1046/j.1523-1755.2003.00720.x. [DOI] [PubMed] [Google Scholar]
- 27.Ganesh SK, Stack AG, Levin NW, Hulbert-Shearon T, Port FK. Association of elevated serum phosphorus, calcium x phosphorus product, and parathyroid hormone with cardiac mortality risk in chronic hemodialysis patients. J Am Soc Nephrol. 2001;12:2131–8. doi: 10.1681/ASN.V12102131. [DOI] [PubMed] [Google Scholar]
- 28.Llach F. Hyperphosphatemia in end-stage renal disease patients: pathophysiological consequences. Kidney Int. 1999;56(Suppl 73):S31–S7. doi: 10.1046/j.1523-1755.1999.07316.x. [DOI] [PubMed] [Google Scholar]
- 29.Juppner H, Brown EM, Kronenberg HM. Parathyroid hormone. In: Favus MJ, editor. Metabolic bone diseases and disorders of mineral metabolism. 4. Philadelphia: Lippincott Williams & Wilkins; 1999. pp. 81–7. [Google Scholar]
- 30.Antonsen JE, Sherrard DJ, Andress DL. A calcimetic agent acutely suppresses parathyroid hormone levels in patients with chronic renal failure. Rapid Comm Kidney Int. 1998;53:223–7. doi: 10.1046/j.1523-1755.1998.00735.x. [DOI] [PubMed] [Google Scholar]
- 31.Naveh-Many T, Friedlaender MM, Mayer H, Silver J. Calcium regulates parathyroid hormone messenger ribonucleic acid (mRNA), but not calcitonin mRNA in vivo in the rat. Dominant role of 1, 25-dihydroxyvitamin D. Endocrinology. 1989;125:275–80. doi: 10.1210/endo-125-1-275. [DOI] [PubMed] [Google Scholar]


