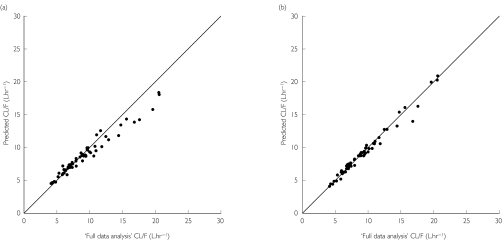
Figure 2.
Relationship of apparent oral clearance values determined from the full data analysis, and maximum a posteriori probability (MAP) Bayesian prediction for (R)-methadone using only a single trough plasma methadone concentration time-point (a) and combined trough and 4 h postdose plasma methadone concentration time-points (b). The solid line is the line of identity (y = x)

