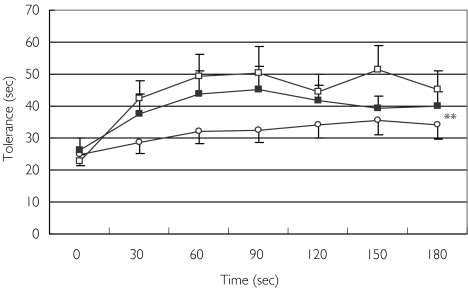
Figure 3.
Effect of morphine (○), oxycodone (□), and the combination of morphine and oxycodone (▪) on pain tolerance. Data are presented as means ± SEM. **Significant difference in mean postbaseline values of the combination treatment and of oxycodone treatment from that of morphine alone (P = 0.006 and 0.007, respectively)

