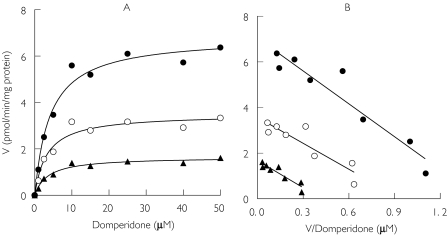
Figure 7.
Kinetic plots for domperidone metabolism in expressed human CYP3A4. (A) Michaelis-Menten plots of apparent formation rates of metabolites vs domperidone concentrations. (B) The corresponding Eadie-Hofstee plots are displayed. Each data point represents the mean of duplicate measurements. The derived kinetic parameters are shown in Table 1. MIII (•), MII (▴), MI (○)

