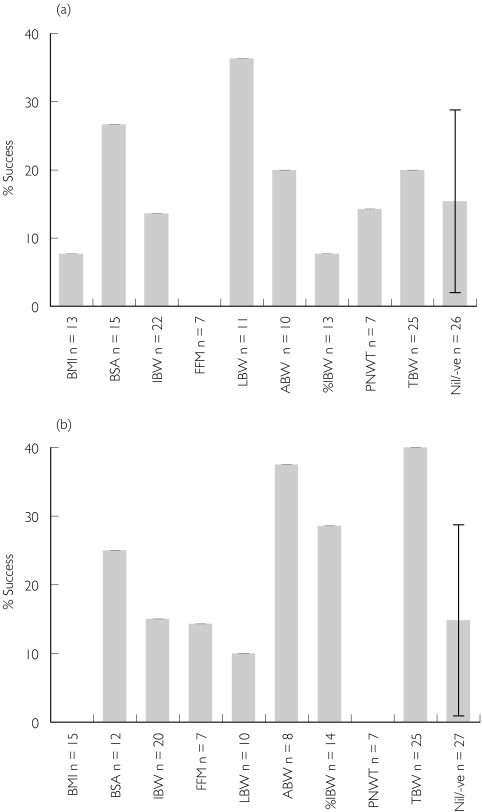
Figure 1.
The percent success of the size descriptor, dependent upon the number of times it was considered in the regression or population pharmacokinetic analysis; n denotes the number of studies in which the size descriptor was evaluated. The error bar on the null model represents the 95% confidence interval. (a) The pharmacokinetic parameter clearance (CL). (b) Volume of distribution (V)

