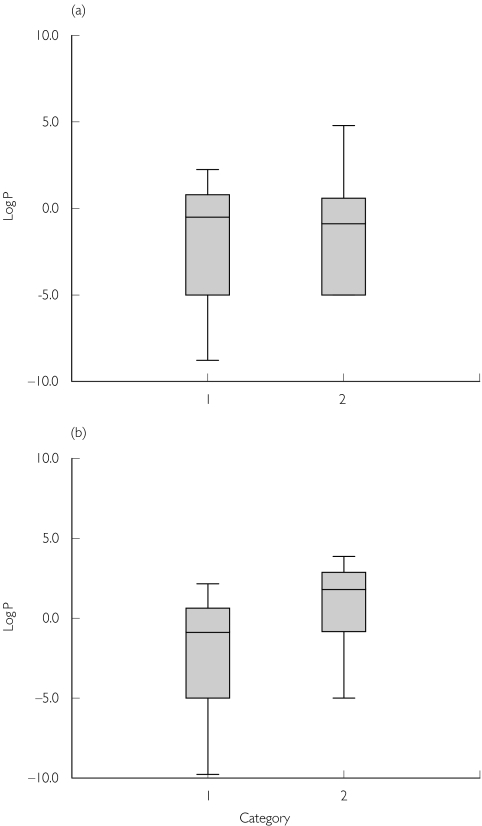
Figure 2.
A box plot of log P-values for each drug vs. category of the best descriptor for that drug. Category 1 size descriptors were adjusted body weight (ABW), body surface area (BSA), predicted normal weight (PNWT), ideal body weight (IBW) and lean body weight (LBW) and category 2 were total body weight (TBW), %IBW and body mass index (BMI). (a) The pharmacokinetic parameter clearance (CL). (b) Volume of distribution (V)

