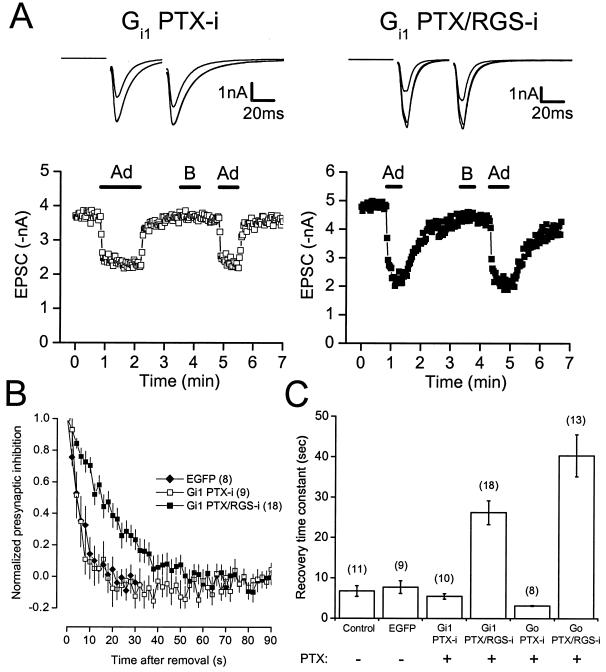
Figure 2.
The recovery time course of adenosine-induced presynaptic inhibition mediated by PTX-insensitive and PTX/RGS-insensitive Gα subunits. (A) The time course of presynaptic inhibition is plotted for neurons pretreated with PTX (100 ng ml−1, >24 h) and expressing PTX-insensitive or PTX/RGS-insensitive Gαi1 subunits. Adenosine (20 μM) and baclofen (50 μM) were applied where indicated by the horizontal bars. Note the slow recovery from presynaptic inhibition mediated by PTX/RGS-insensitive Gαi1. Above each plot are superimposed traces (average of five consecutive recordings each) recorded under control conditions, in the presence of adenosine, and in the presence of baclofen. (B) Recovery from presynaptic inhibition (normalized to steady state) is plotted vs. time for neurons expressing EGFP (first 30 s only), PTX-insensitive Gαi1, and PTX/RGS-insensitive Gαi1. Points represent the mean ± SEM; the number of experiments (n) is given in parentheses. (C) Summary of recovery from presynaptic inhibition. Bars represent the mean ± SEM of recovery time constants derived from single exponential fits to plots of EPSC amplitude vs. time after drug removal. The experimental conditions (virus and toxin treatment) are indicated below each bar.

