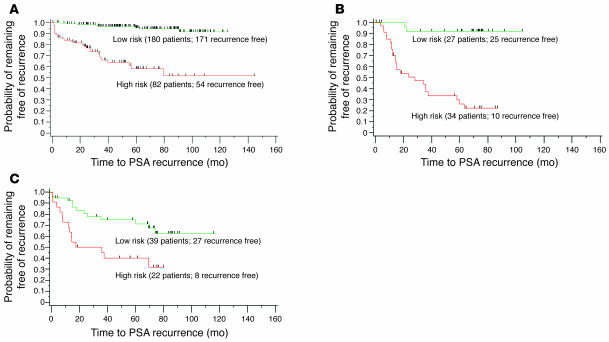
Figure 3. Kaplan-Meier curves of freedom from PSA recurrence, according to SVRc model score.
(A) Training cohort. (B) Validation cohort. Patients were stratified into low- and high-risk groups based on the sensitivity/specificity cut points. Tick marks indicate censored patients. (C) Validation cohort based on MSKCC 5-year PSA recurrence (PSAR) progression-free nomogram. Patients were stratified into high- and low-risk groups based on nomogram predictions (using an optimized log-rank c2 cut point) of probability of remaining free of recurrence.

