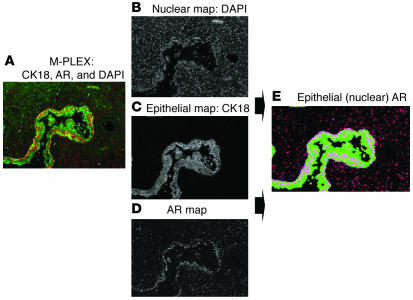
Figure 4. Spectral image segmentation for quantifying nuclear AR in control prostate tissue.
(A) Multiplex immunofluorescent image of prostate tissue stained with DAPI for nuclei (not shown), CK18 labeled with Alexa Fluor 488 for epithelial cells (green), and AR labeled with Alexa Fluor 568 for stroma and epithelial cells (red). By applying spectral optics to separate the respective fluorochromes, individual grayscale images were created for nuclei (B), epithelial cells (C), and AR (D). (E) Using algorithms based on pixel and object classification, a composite color image was rendered that segmented the AR that was present in DAPI-stained nuclei that were within CK18+ epithelial cells as well as the AR that was present in nuclei that were CK18 negative (stroma). The segmented image was the basis for quantifying the AR in epithelial nuclei as well as the AR within the stroma. Parameters calculated included overall nuclear area involved with AR, mean and maximum intensity, and distribution (% positive cells).

