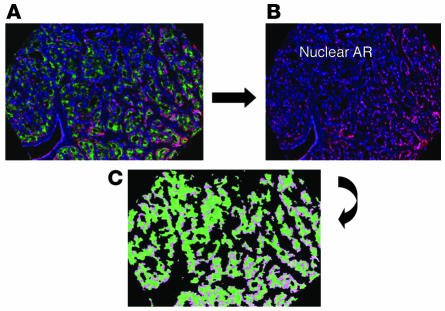
Figure 5. Multiplex immunofluorescence of a representative TMA core utilized for quantifying AR.
(A) Combined immunofluorescent image of prostate cancer stained with DAPI for nuclei (blue), CK18 for epithelial cells (green), and stromal and epithelial AR (dark pink). In B, the CK18 was removed and only the stromal and epithelial nuclear AR (dark pink) remained with DAPI-stained nuclei that were AR negative (blue). (C) After segmentation and classification, a composite image was generated that highlighted the nuclear AR (light pink) only in epithelial cells, which was then quantified based on the pixel intensity (brightness) of the AR.

