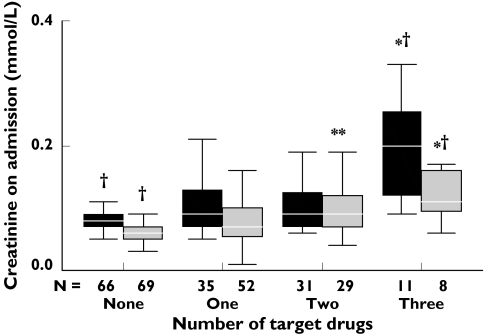
Figure 1.
Creatinine levels for males and females vs. number of target drugs. P for trend (for both males and females combined = 0.008). Significant difference from control, *P < 0.05; **P < 0.001. Significant difference between males and females in groups on same number of target drugs, †P < 0.05. The box plot shows median and the quartiles directly above and below the median. The outer bars show the outer two. Male (▪), female ( )
)

