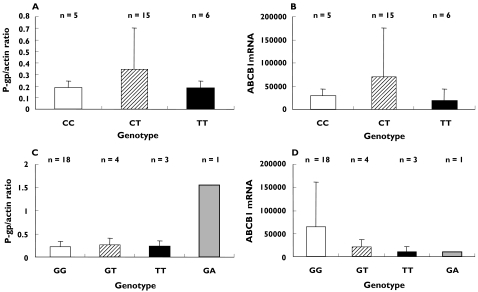
Figure 1.
Relationship between the C3435T and G2677T(A) genotypes and hepatic P-gp and ABCB1 mRNA expression. (A) P-gp expression and C3435T genotype expressed as optical density of the P-gp band normalized against that of the β-actin band, (B) ABCB1 mRNA expression and C3435T genotype expressed as copies per 50 ng of cDNA, (C) P-gp expression and G2677T(A) genotype and (D) ABCB1 mRNA expression and G2677T(A) genotype

