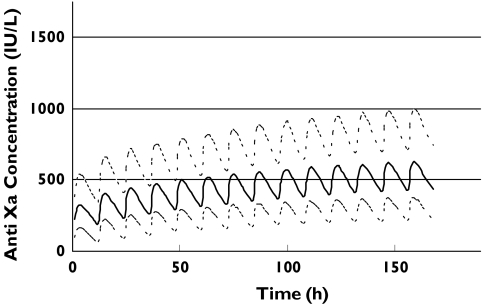
Figure 2.
Simulated anti-Xa concentrations for patients with a distribution of renal function recruited in the study using the variable dosing strategy shown in Table 4. The upper, middle and lower lines represent the 90th, 50th and 10th percentiles, respectively

