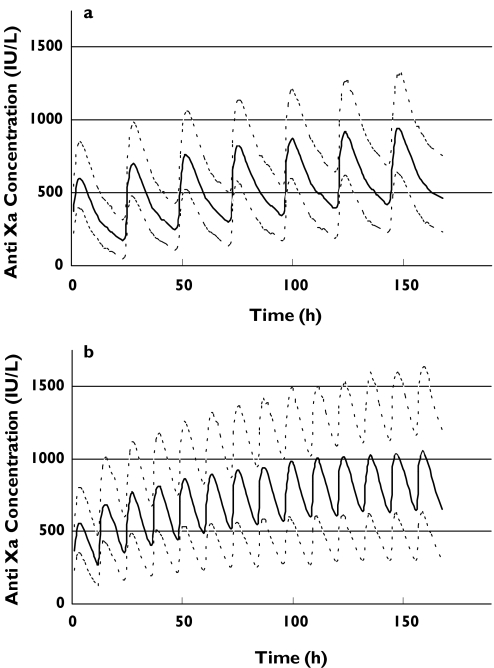
Figure 5.
Simulated anti-Xa concentrations using the current manufacturer's dosing recommendations (in Australia). The upper, middle and lower lines represent the 90th, 50th and 10th percentiles, respectively. Figure 5(a) represents patients with GFR < 30 ml min−1 given 1.0 mg kg−1 of enoxaparin (total body weight) once daily and Figure 5(b) represents patients with a GFR ≥ 30 ml min−1 given 1.0 mg kg−1 of enoxaparin (total body weight) twice daily

