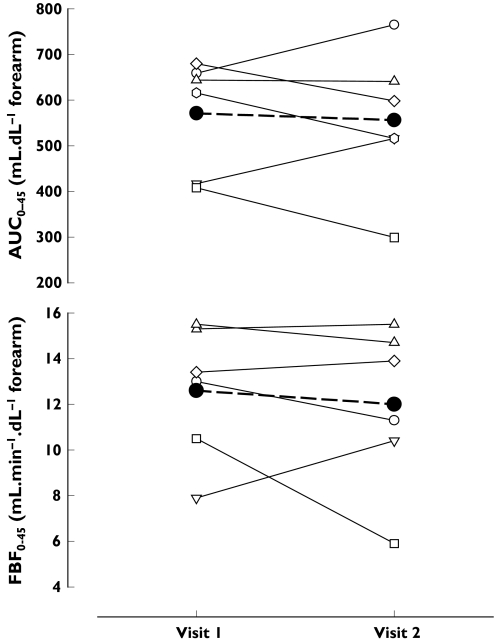
Figure 3.
Summary responses (AUC0−45 and ΔFBF0−45) to intrabrachial infusion of CGRP (45 min continuous infusion, 10 ng min−1 dl−1 forearm) on visit 1 and visit 2. Individual responses (n = 6) are shown as thin lines with open symbols. A thick dashed line with closed circles indicates the mean response

