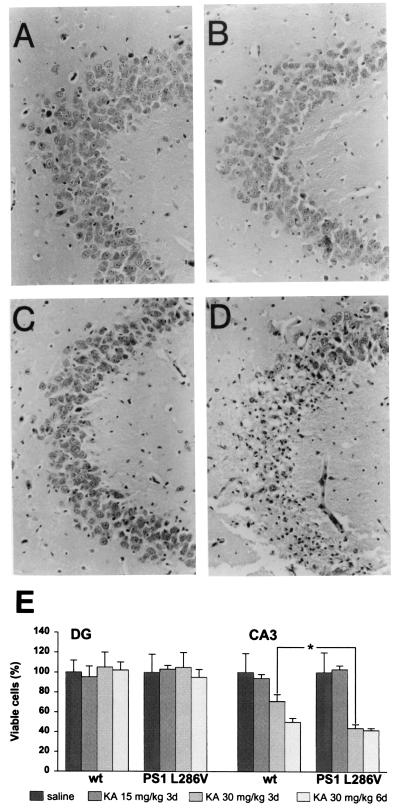
Figure 3.
Effect of KA injection on neuronal viability in hippocampi from wt and PS1 tg mice. (Upper) Representative micrographs of CA3 hippocampal region from wt FVB/N (A and C) and PS1 L286V tg (B and D) mice treated with saline (A and B) or 30 mg/kg KA (C and D) and killed 3 days after the lesion. (E) Quantitative analysis of KA-induced cell loss in the CA3 and dentate gyrus (DG) hippocampal region of wt FVB/N and PS1 L286V tg mice treated with either 15 mg/kg or 30 mg/kg KA and killed after 3 days (3d) or 6 days (6d), as indicated. Viable cells were evaluated by estimating the mean profile number per mm2. Data are expressed as the percent of the corresponding control values (black bar) and represent the mean ± SEM of at least 15 sections per each brain. Absolute values were 7.5 ± 0.9 × 10⁵ and 6.9 ± 1.3 × 10⁵ profile number per mm2 in dentate gyrus of wt and PS1 tg mice, respectively, and 2.1 ± 0.4 × 10⁵ and 2.5 ± 0.5 × 10⁵ profile number per mm2 in CA3 region of wt and PS1 tg mice, respectively. *, P < 0.05 vs. the corresponding values of wt group.

