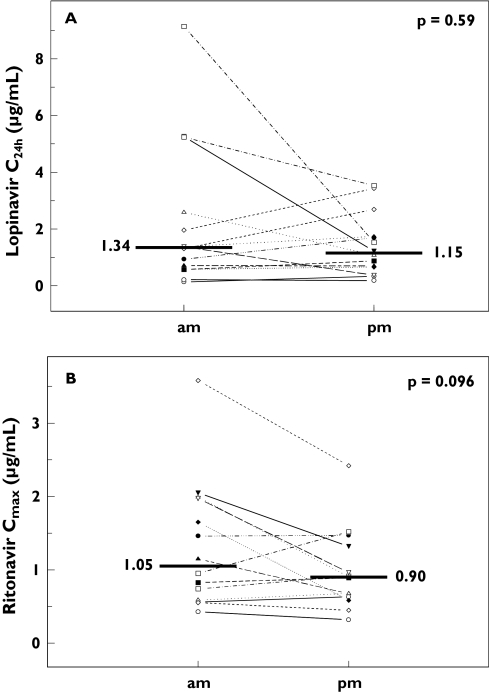
Figure 2.
Individual changes in lopinavir concentration at 24 h postdose (C24h; Figure 2A) and maximum ritonavir concentration (Cmax; Figure 2B) after steady-state administration of lopinavir/ritonavir 800/200 mg once daily with food in the morning (am) or in the evening (pm) in 14 HIV-1-infected male individuals. The horizontal lines indicate the median

