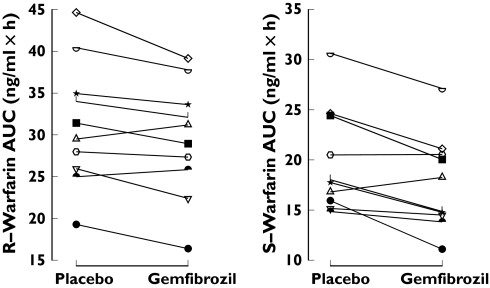
Figure 2.
Individual area under the concentration-time curve (AUC(0–∞)) values of R- and S-warfarin in 10 subjects after ingestion of 10 mg racemic warfarin during the placebo and gemfibrozil phases. Cross-over treatment sequences: placebo-gemfibrozil (open symbols), gemfibrozil-placebo (solid symbols)

