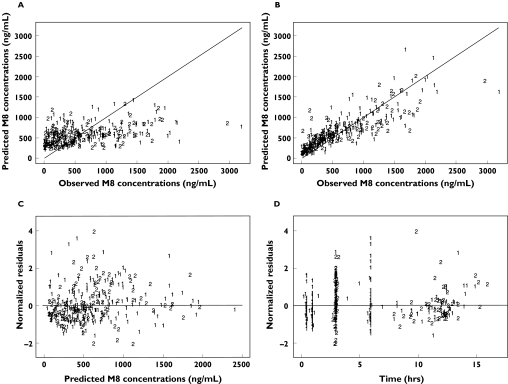
Figure 4.
Goodness of fit plots based on the final model for M8: population predicted concentrations vs. observed concentrations (A), individual predicted concentrations vs. observed concentrations (B), population weighted residuals vs. observed concentrations (C) and population weighted residuals vs. time (D)

