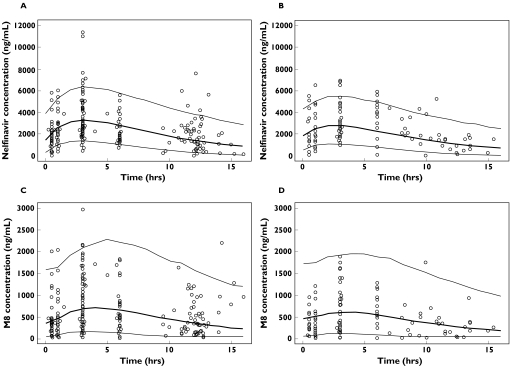
Figure 5.
Evaluation of the final model: comparison between the 10th, 50th (in bold) and 90th percentiles obtained from 1000 simulations for patients receiving 1250 mg twice daily (A: nelfinavir, C: M8) and 750 mg three times daily (B: nelfinavir, D: M8) of nelfinavir, and the observed data at V1 and V2 in patients receiving the corresponding dosing regimen

