Figure 2.
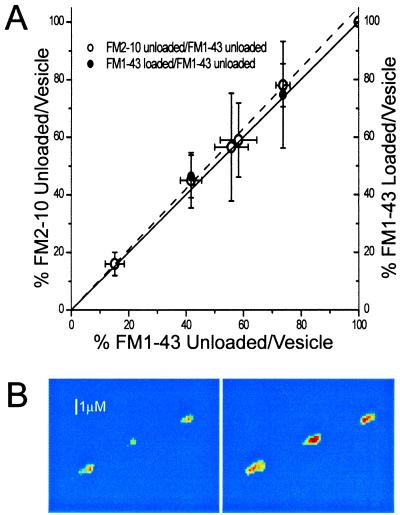
Two modes of exocytosis exist. (A) Percent FM2–10 and FM1–43 released per quantum released (open circles) and percent FM1–43 taken up per quantum released (filled circles) with hypertonicity of solution as a parameter (Left to Right), the hypertonicities are 1.5, 1.0, 0.8, 0.6, 0.5, and 0.0 (nerve impulse stimulation) osM. For example, the left-most point is derived from experiments in which the release was produced by a 1.5-osM solution; the left ordinate value is the percentage dye release from FM2–10 loaded synapses, and the abscissa value is the percent dye released from FM1–43 loaded synapses. All percentage uptake and release are relative to the dye released or taken up per quantum of glutamate release produced by action potentials. Data for the abscissa is from experiments of Fig. 1. FM2–10 dye release data from 365 synapses in 5 experiments and FM1–43 dye uptake data, from 520 synapses in 5 experiments; error bars indicate one SEM, with the larger of the overlapping error bars associated with the filled circles (dye uptake measurements have more error). The solid line has a slope of one (equality for ordinate and abscissa), and the dotted line, with a slope of 1.05, is the least squares fit to the data. (B) Example of three synapses loaded with FM1–43 by 1 osM hypertonic solution application (Left) and then (after prolonged stimulation to release dye) by action potential stimulation (Right); much less dye was loaded with hypertonic stimulation, although in each case the preparation had been stimulated to release the same amount of neurotransmitter. The images were thresholded and false colored after subtraction of corresponding nonspecific fluorescence remaining after prolonged stimulation. The color map ranges from blue to red for increasing fluorescence and is intended to show the relative difference between dye uptake with hypertonic and action potential stimulation.

