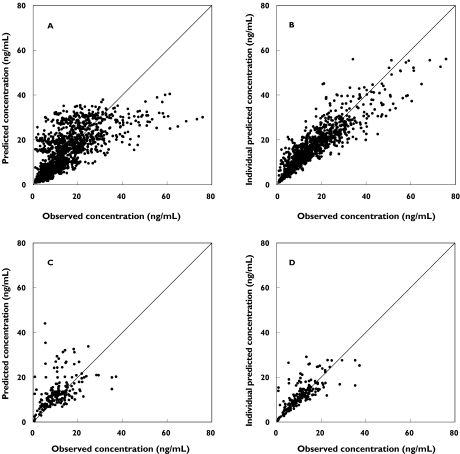
Figure 2.
Plot of observed epinastine concentration vs. final model-predicted epinastine concentration. (A) predicted concentration and (B) individual predicted concentration in healthy adults; (C) predicted concentration and (D) individual predicted concentration in paediatric atopic dermatitis patients. The line represents the line of identity

