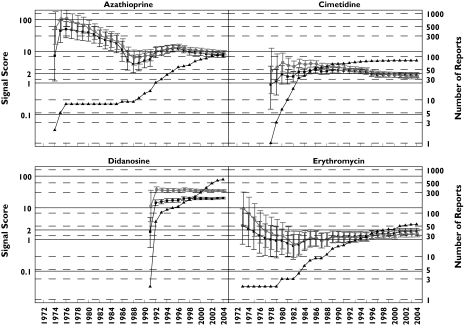
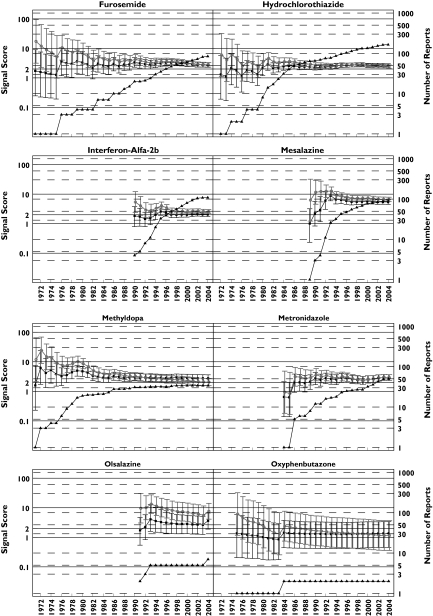
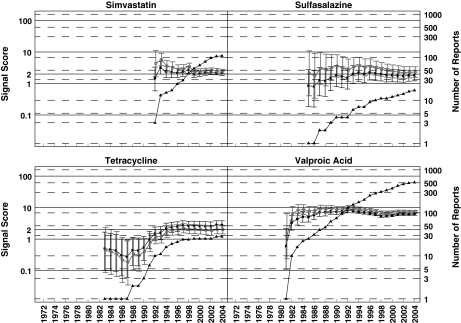
Figure 2.
Pancreatitis analysis: progression of cumulative data mining signal scores and confidence intervals with MGPS and PRR for pancreatitis associated with the 16 drugs described in the second letter to the editor [2]. Left y-axis: signal scores for the MGPS (dark squares) and PRR (light circles) and the lower and upper 90% confidence interval limits; right y-axis, number of reports (dark triangles); x-axis, time in years labelled biennially. The wide and overlapping confidence intervals of MGPS and PRR are inconsistent with the letter's implication that PRR performed more robustly than MGPS in the detection of these drug–event combinations [2]. One notable exception is didanosine, a drug used to treat AIDS patients which shows a large signal for both PRR and MGPS, with PRR and MGPS confidence intervals that do not overlap as with the other drugs analysed. This is very likely a result of stratifying by age, sex, and year with MGPS, but not with PRR, since the drug–event combination is concentrated in a small number of strata. This figure shows signals for drugs having a wide range of reports throughout the years. Note that didanosine and valproic acid reach the highest number of reports with 597 and 511 reports, respectively, in July 2004. However, for these 16 drugs, n-values of 1 and 2 are the most frequent. For example, a total of 29 data points have an n = 1. They included, 9 years for oxyphenbutazone, 7 years for furosemide, 5 years for tetracycline, 2 years each for hydrochlorothiazide, metronidazole, and sulfasalazine; and 1 year each for cimetidine, mesalazine, methyldopa, and valproic acid. These low frequency counts give inflated PRR estimates. EBGM (▪), N (▴), PRR (○)


