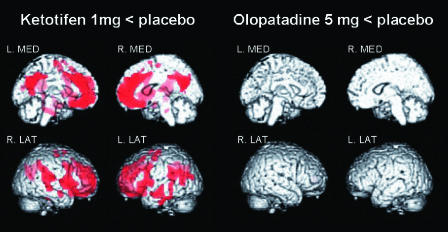
Figure 2.
Results of voxel-by-voxel comparison of brain distribution volume (DV) images. The red colour shows areas of significantly lower DV after ketotifen treatment vs. after placebo treatment (‘Ketotifen 1 mg < placebo’ in the left columns). In contrast, there are no areas of significantly lower DV after olopatadine treatment than after placebo treatment (‘Olopatadine 5 mg < placebo’ in the right columns). In both columns, significant areas are demonstrated in four aspects such as left and right medial (L. MED and R. MED) and right and left lateral (R. LAT and L. LAT) aspects (P < 0.001, uncorrected, using SPM99)

