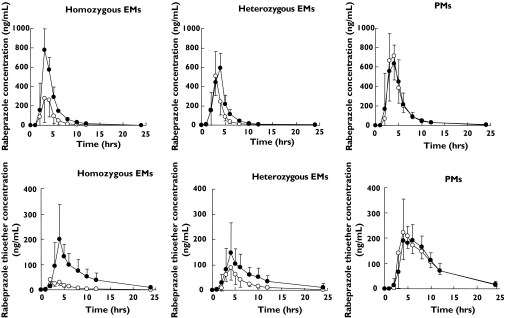
Figure 1.
Plasma concentration-time curves of rabeprazole (upper panel) and rabeprazole thioether (lower panel) during placebo and fluvoxamine treatments in homozygous extensive metabolizers (EMs) (n = 7), heterozygous EMs (n = 8), and poor metabolizers (PMs) (n = 6) for CYP2C19. Data are shown as mean and bars are SEM. Open circles and closed circles indicate data during placebo and fluvoxamine treatments, respectively

