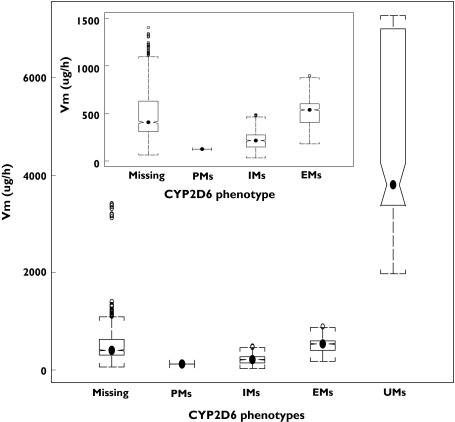
Figure 3.
Box plot of Vm estimates for each CYP2D6 phenotype group. Dots in each group were median values. Notches show approximate 95% confidence limits for the median. CYP2D6 genotype was classified into one of the four CYP2D6 phenotype groups based on the phenotype–genotype relationship. In this plot, PMs = poor metabolizers, IMs = Intermediate metabolizers, EMs = extensive metabolizers, UMs = ultra-rapid metabolizers. Missing = Subject was missing CYP2D6 phenotype information

