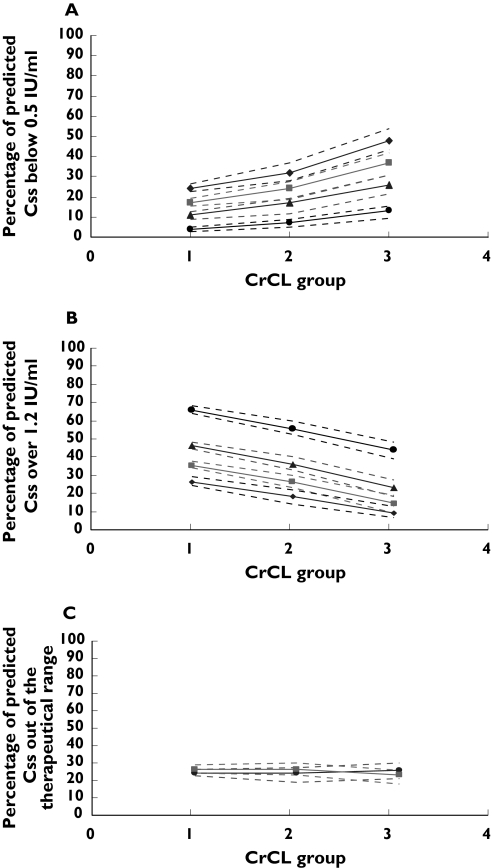
Figure 3.
The percentage of predicted Css falling out of therapeutic range at different infusion rates (8.3, 5.8, 5.0, 4.2 IU kg−1 h−1) for intensive care unit patients with different renal function (1, CrCL <30 ml min−1; 2, CrCL 30–50 ml min−1; 3, CrCL >50 ml min−1). Dashed lines represent the 5th and 95th percentiles (90% PI). (a) Percentage of predicted Css which is <0.5 IU ml−1. ♦, 4.2 IU/kg/h; ▪, 5.0 IU/kg/h; ▪, 5.8 IU/kg/h; •, 8.3 IU/kh/h. (b) Percentage of predicted Css which is >1.2 IU ml−1. ♦, 4.2 IU kg−1 h−1; ▪, 5.0 IU kg−1 h−1; ▴, 5.8 IU kg−1 h−1; •, 8.3 IU kg−1 h−1. (c) Percentage of predicted Css falling out of therapeutic range (0.5–1.2 IU ml−1) when patients with CrCL <30 ml min−1 received enoxaparin at 4.2 IU kg−1 h−1 infusion rate, with CrCL between 30 and 50 ml min−1 received enoxaparin at 5.0 IU kg−1 h−1 infusion rate and with CrCL >50 ml min−1 received enoxaparin at 5.8 IU kg−1 h−1 infusion rate. ▪, >1.2 IU ml−1; •, <0.5 IU ml−1

