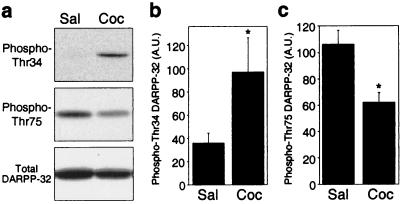
Figure 2.
Regulation by acute cocaine of DARPP-32 phosphorylation at Thr-34 and Thr-75. Data are shown for mice treated with saline (Sal) or cocaine (Coc). (a) Representative immunoblots for detection of each phosphorylation site and for total DARPP-32 are shown. (b and c) The amounts of phospho-Thr-34 DARPP-32 (b) and phospho-Thr-75 DARPP-32 (c) were quantified by densitometry. Data represent means ± SEM for five to six mice per group. *, P < 0.05 compared with saline-injected mice, Student's t test.

