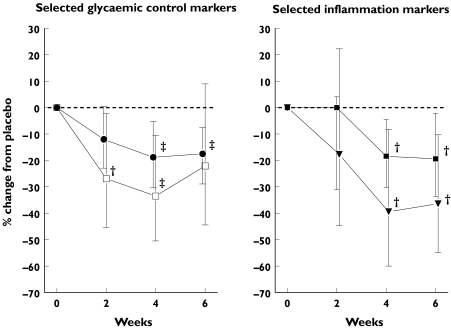
Figure 3.
Timing of treatment effects relative to placebo for selected markers (T2DM group only). The left figure shows the percentage change in time of plasma insulin and fasting plasma glucose (FPG) concentrations for rosiglitazone (RSG) vs. placebo treatment in the T2DM group. The right figure shows the plasma IL-6 concentrations and white blood cell count (WBC) for RSG vs. placebo treatment in the T2DM group. •, Fasting plasma glucose (FPG); □, insulin; ▾, IL-6; ▪, WBC. The bars indicate 95% confidence intervals. †P ≤ 0.05; ‡P ≤ 0.01

