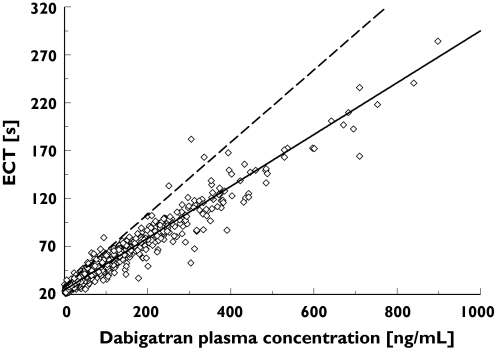
Figure 5.
The relationship between patient ecarin clotting time (ECT) values and dabigatran plasma concentrations > 100 h after first administration of dabigatran etexilate (steady state) following orthopaedic surgery. Individual patient ECT values are indicated by empty squares. The dashed black line represents the fit of the linear ECT model to the early (0–12 h post surgery) data; the solid grey line represents the fit of the model to the late (>100 h post surgery) data. SLOP and BASE at time 0 h (- - -), individual values > 100 h (⋄), SLOP and BASE at time 150 h (——)

