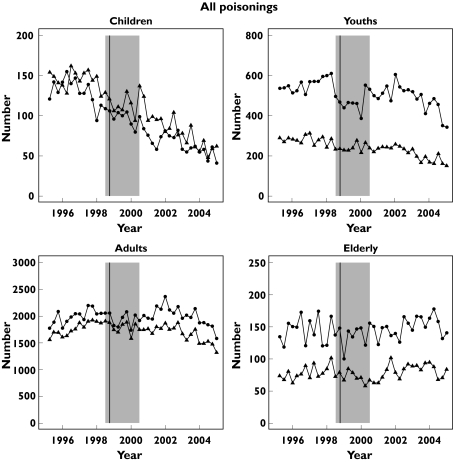
Figure 1.
Number of discharges per quarter in Scotland with a diagnosis of poisoning 1996–2004 by age group (children < 10 years, youth 10 to < 20 years, adult 20 to < 70 years, elderly ≥ 70 years). The vertical line identifies the quarter of the licence change and the shaded area indicates the period of transition

