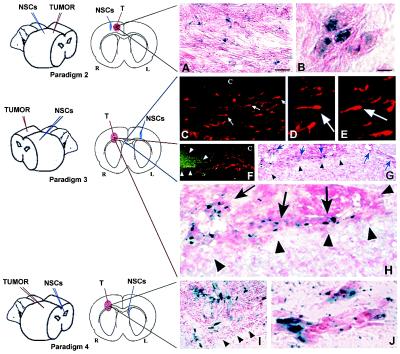
Figure 3.
NSCs implanted at various intracranial sites distant from main tumor bed migrate through normal adult tissue toward glioma cells. (A and B) Same hemisphere but behind tumor (Paradigm 2). Shown here is a section through the tumor from an adult nude mouse 6 days after NSC implantation caudal to tumor. In A (as per the schematic, a coned down view of a tumor populated as pictured under low power in Figs. 2A and 3 A and B), note X-Gal+ blue NSCs interspersed among dark neutral red+ tumor cells. (B) High power view of NSCs in juxtaposition to islands of tumor cells. (C–H) Contralateral hemisphere (Paradigm 3). (C–E) As indicated on the schematic, these panels are views through the corpus callosum (“c”) where β-gal+ NSCs (red cells, arrows) are seen migrating from their site of implantation on one side of the brain toward tumor on the other. Two representative NSCs indicated by arrows in C are viewed at higher magnification in D and E, respectively, to visualize the classic elongated morphology and leading process of a migrating neural progenitor oriented toward its target. In F, β-gal+ NSCs (red) are “homing in” on the GFP+ tumor (green) having migrated from the other hemisphere. In G, and magnified further in H, the X-Gal+ blue NSCs (arrows) have now actually entered the neutral red+ tumor (arrowheads) from the opposite hemisphere. (I and J) Intraventricular (Paradigm 4). Shown here is a section through the brain tumor of an adult nude mouse 6 days following NSC injection into the contralateral cerebral ventricle. In I, as per the schematic, blue X-Gal+ NSCs are distributed within the neutral red+ main tumor bed (edge delineated by arrowheads). At higher power in J, the NSCs are in juxtaposition to migrating islands of red glioblastoma cells. Fibroblast control cells never migrated from their injection site in any paradigm. All X-Gal-positivity was corroborated by anti-β-gal immunoreactivity. (Scale bar: A, 20 μm, and applies to C; B, 8 μm, 14 μm in D and E, 30 μm in F and G, 15 μm in H, 20 μm in I, and 15 μm in J.)

