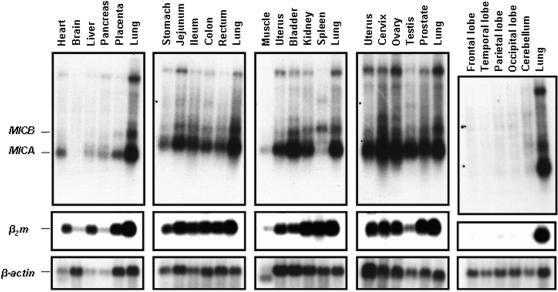
Figure 1. Northern blot analysis of MICA and MICB expression in various healthy organs.
The panel represents RNA originating from major human organs. Each panel contains lung RNA as an internal standard. Top panel was hybridized with MICA cDNA. The differential transcript length of MICA and MICB is due to a previously documented larger 3′UT in MICB mRNA [50]. The middle panel depicts the expression of β2m, indicative of the β2m bound conventional MHC-I expression. Finally the β-actin transcription acts as a loading control. For more detailed explanation see main text.

