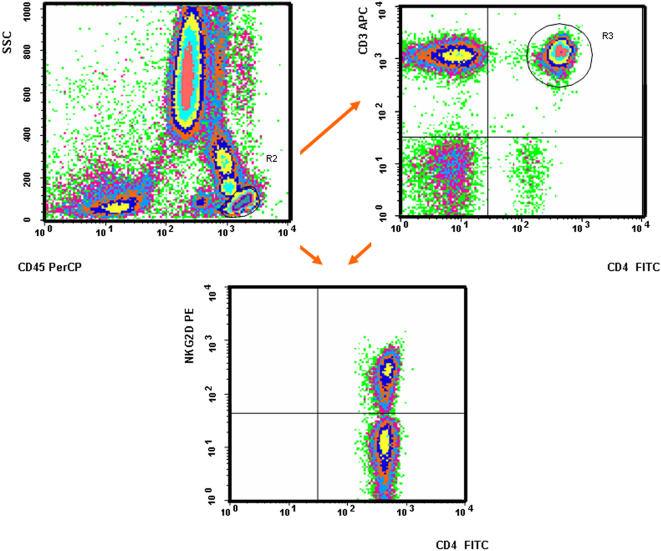
Figure 3. Flow cytometric analysis of the CD4+NKG2D+ population.
This example, taken from one of the two SS patients (Mrs XET) harbouring a particularly high ratio of CD4+NKG2D+ T cells (36.2%) illustrates the methodology used in order to enumerate these cells in all individuals (controls and patients) included in this work during a routine 50 000 events analysis.

