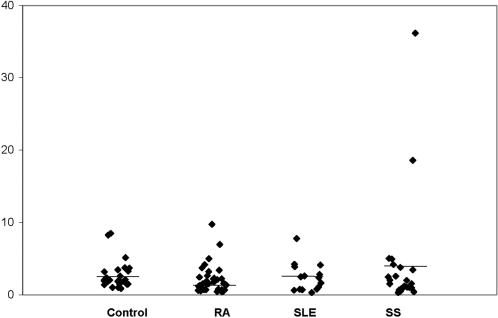
Figure 4. CD4+NKG2D+ T cells autoimmune diseases.
This figure depicts the ratio of CD4+NKG2D+ T cells within the total peripheral CD4 pool in control, RA, SLE and SS individuals. The variability in SS patients is due to 2 individuals whom represent an unusually high ratio (see main text for explanation). None of the differences is significant as assessed by the Wilcoxon text: p = 0.1658 for controls vs. RA; p = 0.9547 for controls vs. SLE and p = 0.5012 for controls vs. SS.

