
Figure 2.
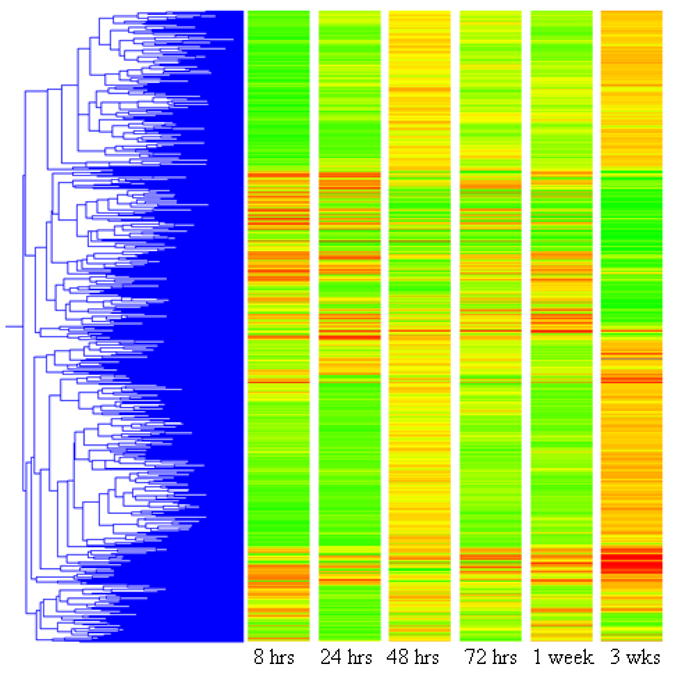
Gene tree depicting those genes with significantly altered expression (t test, p < 0.05, Benjamani-Hochberg multiple test correction) at one or more time points. Genes are clustered for similar expression profiles and are colored by expression level at the specified time point. Bright green genes are down regulated at least 5 fold, bright red genes are up regulated at least 5 fold, and yellow genes are not different from control.