
Figure 4.
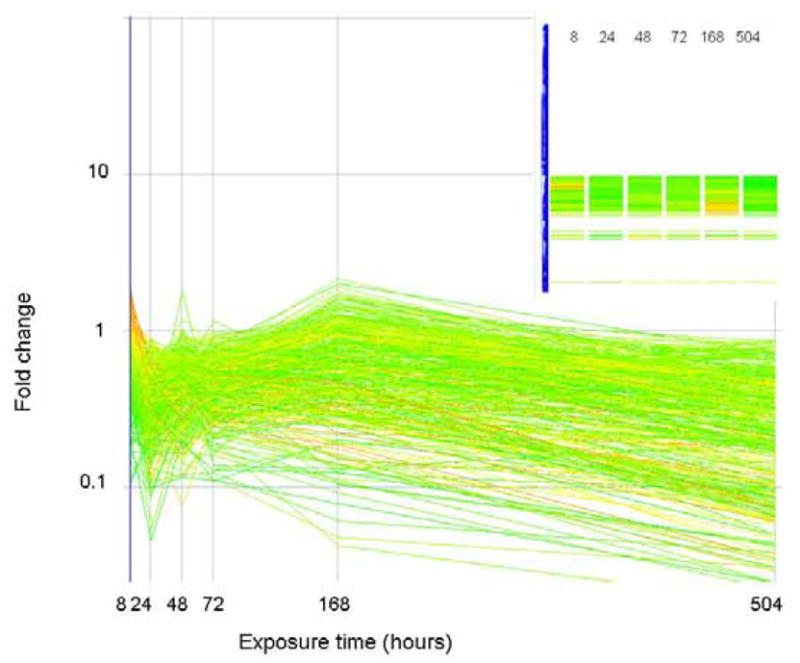
The expression level (as fold change in comparison to control) of genes that correlate (similarity index = 0.8) with a profile that is consistently down regulated are plotted above. Genes are colored by their fold change at t=8 as explained for Figure 2. The inset shows how these genes are arranged in the original clustering algorithim.