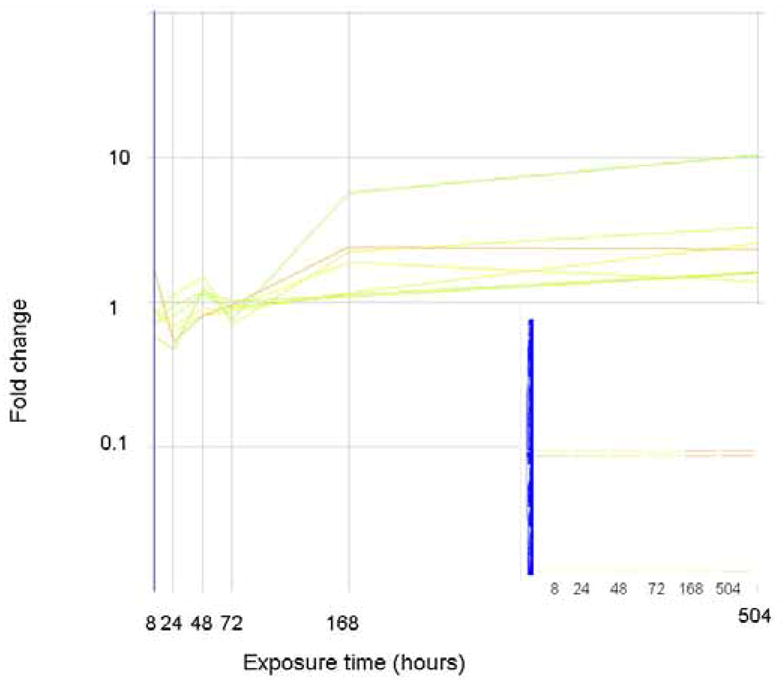
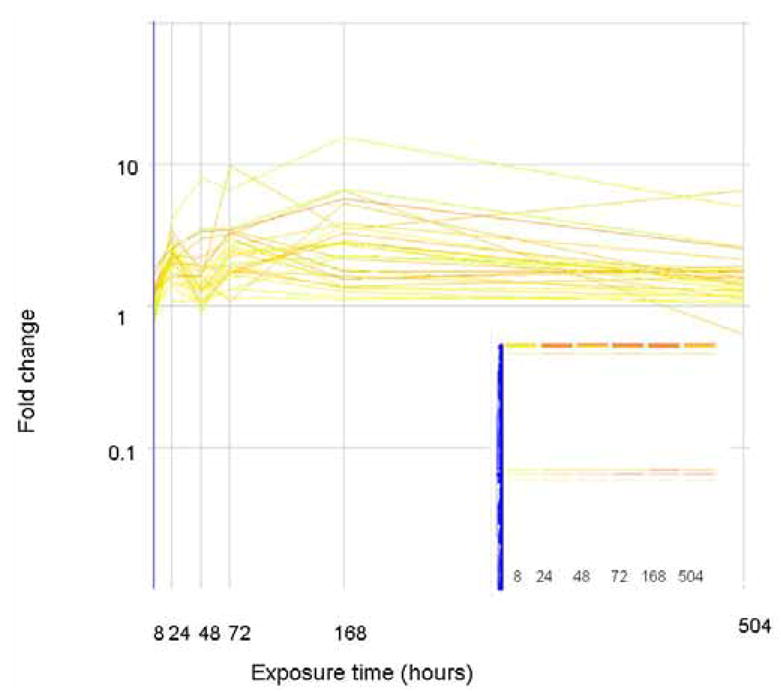
Figure 7.


The expression level (as fold change in comparison to control) of genes that correlate (similarity index = 0.8) with the gene expression profile of vitellogenin. Genes are colored by their fold change at t=8 as explained for Figure 2. The inset shows how these genes are arranged in the original clustering algorithim.
The expression level (as fold change in comparison to control) of genes that correlate (similarity index = 0.8) with the gene expression profile of vitellogenin as measured via qPCR. Genes are colored by their fold change at t=8 as explained for Figure 2. The inset shows how these genes are arranged in the original clustering algorithim.
