
Figure 9.
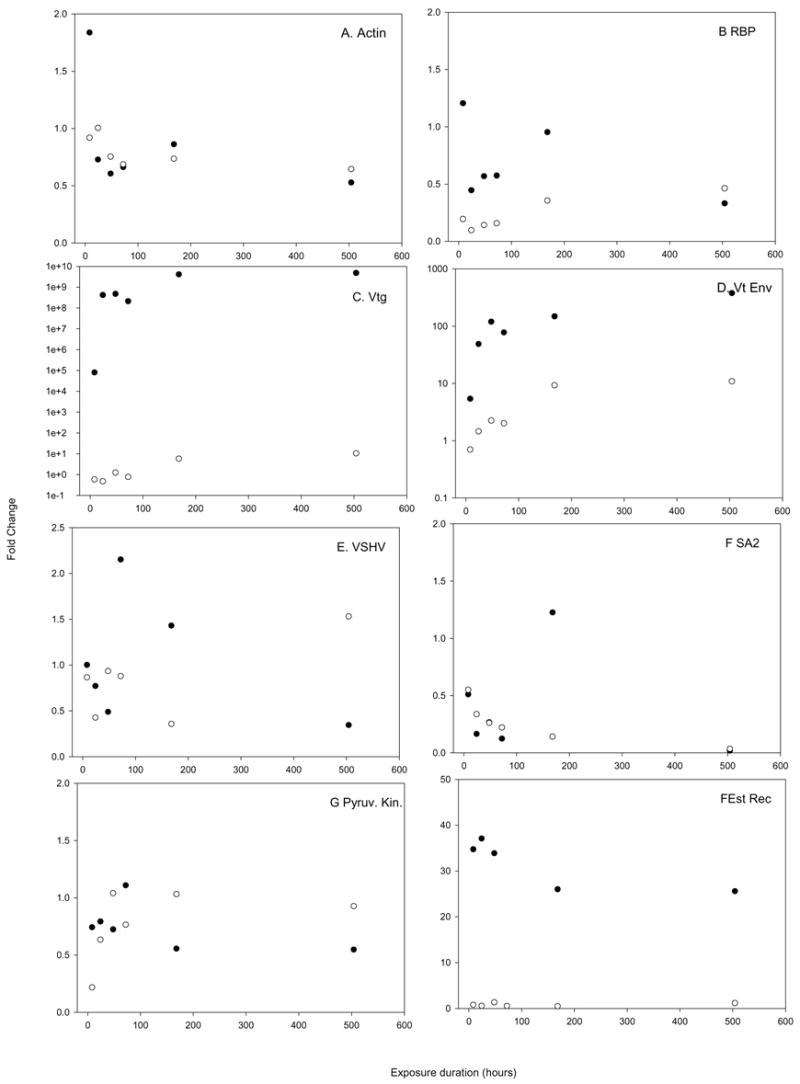
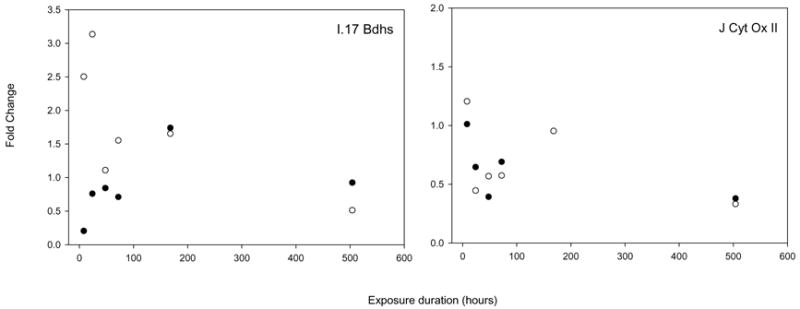
qPCR verification of array results. The expression levels (as fold change in comparison to t=0 controls) are plotted for each of the time points. Open circles denote those measurements made via the array, closed circles denotes those measurements made via qPCR. Panel A shows beta actin, panel B shows a retinol binding protein, panel C shows vitellogenin, panel D show the vitelline envelope protein, panel E shows the VSHV induced protein, panel F shows Serum albumin 2, panel G shows pyruvate kinase, panel H shows the estrogen receptor, panel I shows 17 beta hydroxyl steroid dehydrogenase and panel J shows Cytochrome oxidase II.