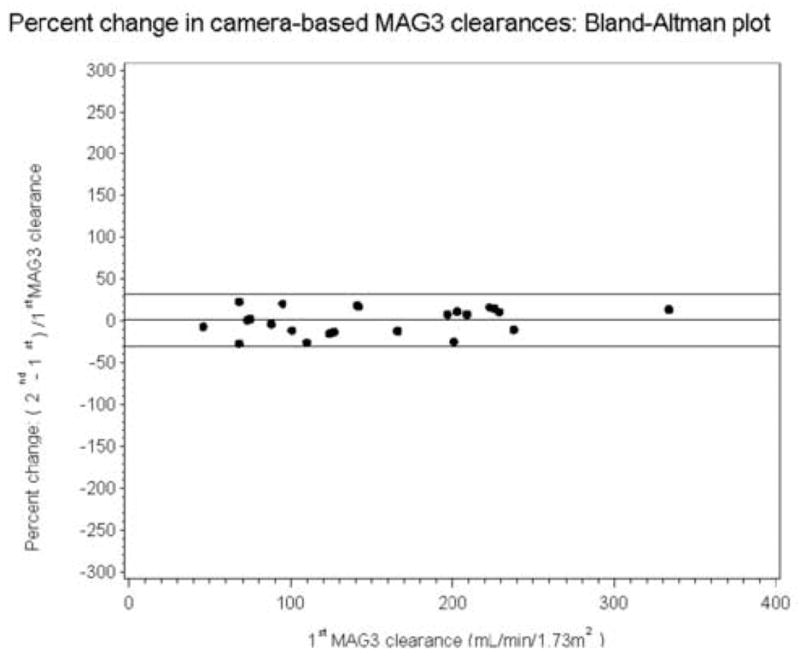
Figure 1B.

Bland-Altman plot showing that the error is relatively constant when it is expressed as a percent of the baseline value [(baseline minus repeat measurement)/baseline value]; the mean percent error was only 1.04% with a SD of 15.7%. Consequently, a change exceeding 31.4% represents a significant change in the camera based MAG3 clearance beyond the error of measurement. The horizontal lines represent the mean error and 1.96 SD of the error.
