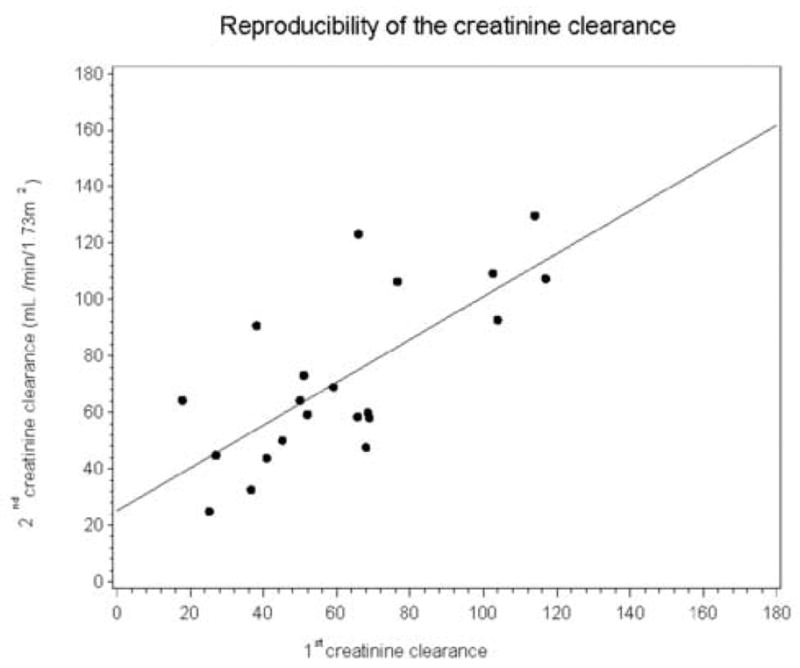
Figure 2A.

Linear regression showing the relationship between the two creatinine clearance measurements. The intercept of the regression line was 25.09, significantly different from zero, p =0.04; however, the slope of the regression line was 0.76, not significantly different from zero, p = 0.15.
