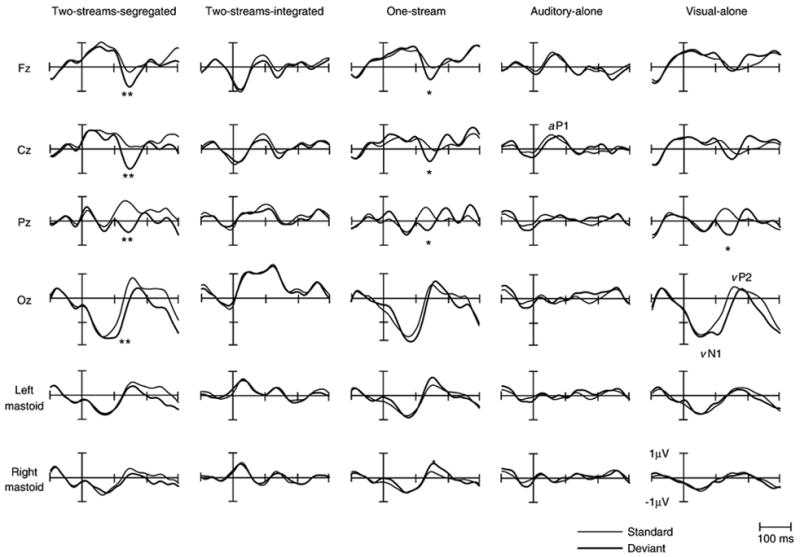
Fig. 1.

Grand-averaged ERP’s elicited by the first stimulus of the three-tone standard (thin line) and deviant (thick line) sequences are displayed for all five conditions at midline electrodes and mastoids. Auditory P1 waveform (aP1) is labeled in the Auditory-alone condition at Cz. The visual N1–P2 waveforms (vN1–vP2) are labeled at Oz in the Visual-alone condition. Significant differences between standard and deviant stimuli, denoting the MMN, are also shown (*p<0.05, **p<0.01).
