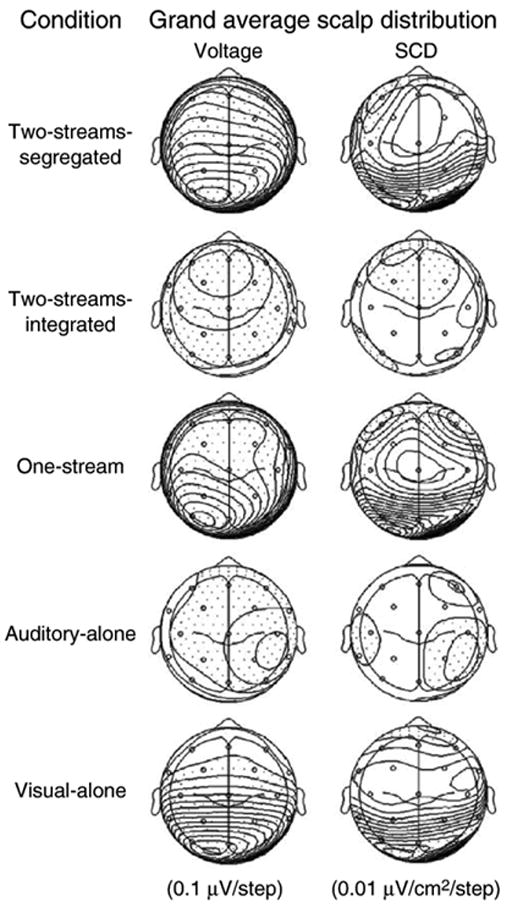
Fig. 3.

Scalp voltage distribution (left) and source current density (SCD) maps (right) are displayed for all conditions of the experiment (top view) calculated on the grand-mean difference potential at a latency of 142 ms. Dotted areas indicate negative values. Two-streams-segregated and One-stream conditions show bilateral foci at F3 and F4 conditions (consistent with bilateral generators of the MMN) as well as a unilateral focus at P3. In the Visual-alone condition, only posterior sinks are discernable.
