
Figure 2.
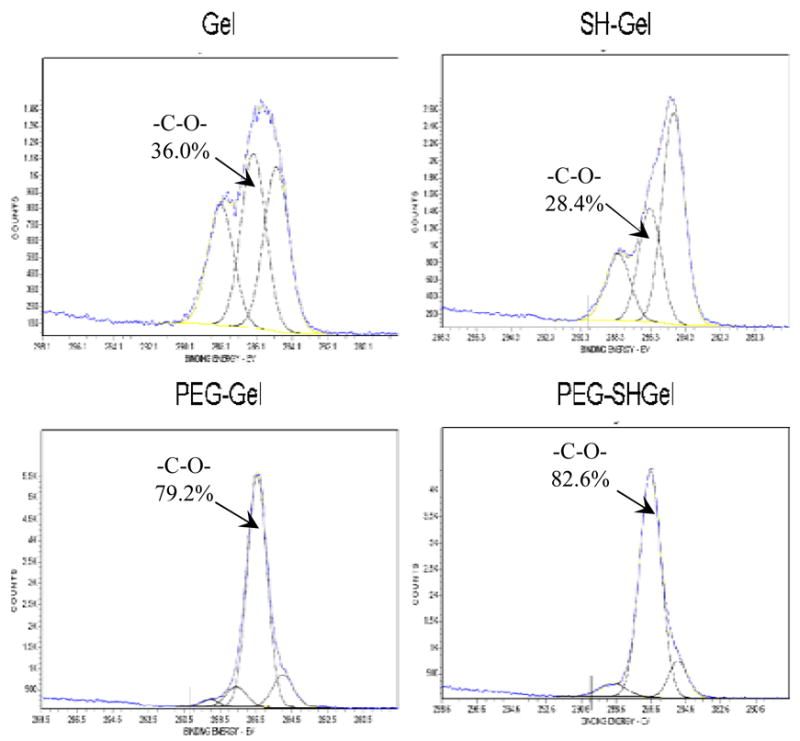
High resolution C1s scans of electron spectroscopy for chemical analysis for the surfaces of gelatin (Gel), thiolated gelatin (SHGel), PEG-modified gelatin (PEG-Gel) and PEG-modified thiolated gelatin nanoparticles (PEG-SHGel). The scans show the peak intensities of the species C-H (hydrocarbon), C-O (ether), and C=O (carbonyl) groups at 285.0, 286.3 and 288.1 eV respectively. The percentage of C-O peak area for each spectra is provided.