
Figure 7.
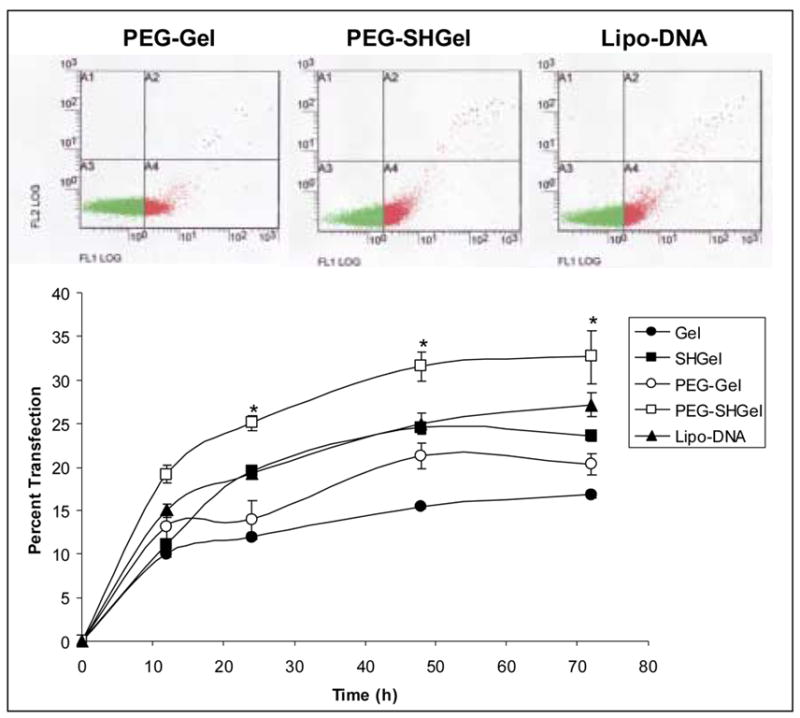
Quantitative transfection profiles of nanoparticles encapsulated with EGFP-N1 plasmid DNA in NIH-3T3 murine fibroblast cells. The percentage of cells transfected was plotted as a function of time post-administration of the plasmid in the gelatin (Gel), thiolated gelatin (SHGel), poly(ethylene glycol)-modified gelatin (PEG-Gel) and poly(ethylene glycol)-modified thiolated gelatin (PEG-SHGel) nanoparticle formulations. Lipofectin®-complexed DNA and naked DNA were used as controls. The top panels show the scatter plot results from flow cytometry, with the cells expressing the fluorescent protein following transfection represented in red and the non-expressing cells in green. (* Statisically significant difference (p<0.05) between the transfection efficiency with PEG-SHGel as compared to Gel and SH-Gel nanoparticles).