
Figure 2.
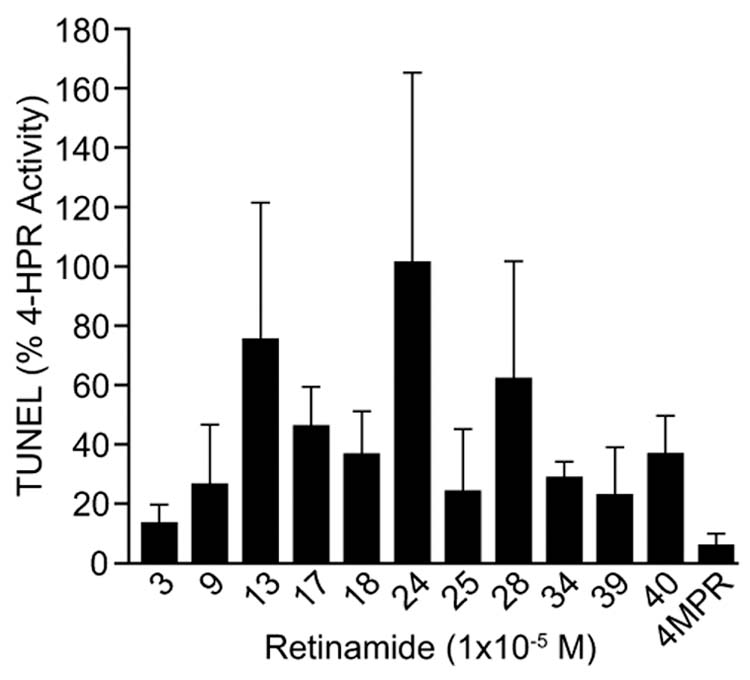
TUNEL staining in MCF-7 cells 48 h after exposure to 10−5M of compound. The results shown represent the mean values (+SEM) from three independent cell culture experiments (intra-assay variability); samples with the highest proportion of dead cells always showed the greatest assay variability (see supplementary materials).