
Fig. 3.
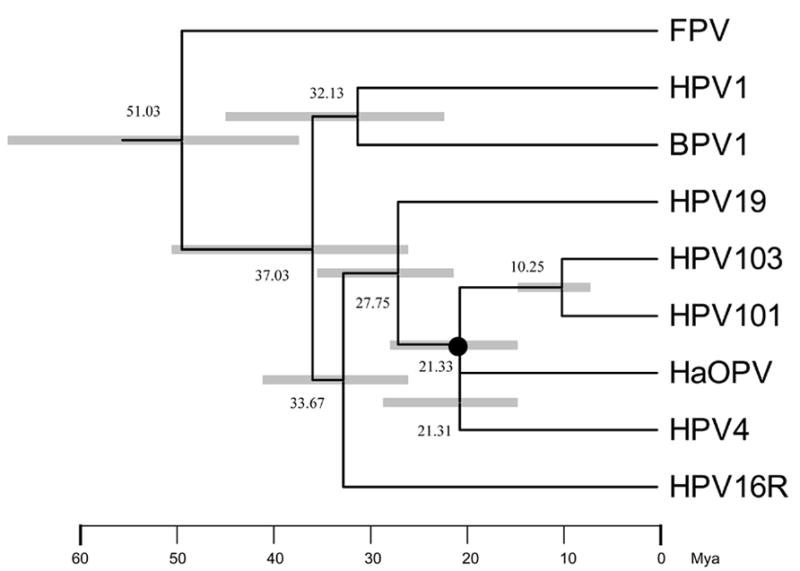
Molecular tree topology of representative papillomaviruses combined with dating of the phylogenetic nodes. Branch lengths are proportional to divergence times. Numbers above the nodes are the mean estimated divergence time (in million years, Mya). The bars in grey represent the 95% highest posterior density (HPD) interval for the divergence times. A Bayesian Markov chain Monte Carlo (MCMC) method was used to calculate divergence times in the BEAST program by selecting the uncorrelated lognormal distribution (UCLD) model. The node of the most recent common ancestor (MRCA) between the clade of HPV101/103 and the Gamma HPVs is denoted with a black circle.